Research Article - (2024) Volume 1, Issue 1
Transitioning from Oil Export to Hydrogen via Solar, Wind, and HeCCGT
2Centre for Propulsion and Thermal Power Engineering, Cranfield University, Cranfield, Bedfordshire M, UK
Received Date: Sep 09, 2024 / Accepted Date: Oct 18, 2024 / Published Date: Oct 25, 2024
Copyright: ©2024 Abdulwahab Rawesat, et al. This is an open-access article distributed under the terms of the Creative Commons Attribution License, which permits unrestricted use, distribution, and reproduction in any medium, provided the original author and source are credited.
Citation: Rawesat, A., Musa, G., Pilidis. P. (2024). Transitioning from Oil Export to Hydrogen via Solar, Wind, and HeCCGT. Ther Res: Open Access, 1(1), 01-23.
Abstract
The analysis focuses on a decarbonization strategy for an oil-exporting country, emphasizing the transition to renewable energy sources through two key scenarios. A baseline is provided, showing individual results for three power generation technologies: solar, wind, and helium closed-cycle gas turbines (HeCCGT). Building on this baseline, the first key scenario explores the combined potential of solar and wind energy, with the H2CCGT (Mean hydrogen combined gas turbine) serving as a backup power generation source when solar and wind resources are unavailable. This scenario provides insights into the combined capacities of solar and wind, their land requirements, and the necessary infrastructure to support continuous energy supply and large-scale hydrogen production. The second scenario advances the analysis by integrating HeCCGT helium closed-cycle gas turbines with solar and wind power, effectively eliminating the need for H2CCGT as a backup. The helium closed-cycle gas turbine works in tandem with solar and wind energy to provide a consistent and reliable power supply, even when solar and wind conditions are not optimal. This scenario also emphasizes the infrastructure required to support an export-oriented hydrogen production strategy, targeting an output of 2100 PJ or 17.5 MT of hydrogen. This strategic analysis serves as a comprehensive guide for understanding the technical and logistical requirements for transitioning from fossil fuels to a sustainable energy system. The study highlights the potential for the country to become a global leader in the hydrogen economy, supported by a diversified and resilient renewable energy infrastructure.
Introduction
The comprehensive global transition towards carbon reduction signifies a substantial transformation in energy paradigms, motivated by the imperative necessity to confront climate change and attain climate neutrality. This change is driven by the movement from relying on fossil fuels to welcoming renewable energy sources (RES), the application of tough energy regulations, and the fusion of groundbreaking technologies. Notably within the Asia-Pacific region, initiatives are focused on the gradual elimination of coal, bolstered by empirical data that underscores the efficacy of clean energy policies in diminishing CO2 intensity in electricity generation, particularly when buttressed by robust governance.Despite these advancements, numerous economies remain substantially dependent on fossil fuels, with forecasts suggesting that in the absence of expedited initiatives, global CO2 emissions may escalate markedly by the year 2050. This predicament is further exacerbated for oil and gas enterprises, which are compelled to reconcile climate objectives with persistent fossil fuel demand, thereby necessitating strategic transformations within their operational frameworks. Consequently, the attainment of net zero emissions will demand comprehensive policy interventions and a fundamental reconfiguration of economic structures [1-5].
In this context, the transformation of economies reliant on oil towards renewable energy sources is imperative for achieving sustainable economic growth and ensuring energy security. Empirical research indicates that the shift towards renewable energy not only propels GDP growth, particularly in nations actively reforming their energy portfolios from fossil fuels to renewables, but also fosters job creation and stimulates technological innovation, thus disrupting conventional energy markets This transition not only promotes economic advancement but also generates employment opportunities and stimulates technological innovation, thereby disrupting conventional energy markets Moreover, the present worldwide movement towards renewable energy is intensified by geopolitical events, such as the war involving Russia and Ukraine, which have showcased the weaknesses linked to fossil fuel reliance and the critical demand for sustainable energy options. Although this transition entails challenges, such as the requisite investment in infrastructure and the management of energy supply intermittency, it concurrently presents considerable economic opportunities and fortifies energy security [6-9].
Customized policy frameworks and cooperative initiatives are critical to navigating these complexities and ensuring an equitable transition for regions that are dependent on traditional energy sources Hence, the shift to renewable energy represents a fundamental environmental responsibility alongside a pressing economic need.Hydrogen is emerging as a pivotal clean energy vector in the transition towards a sustainable energy system, providing considerable advantages such as high conversion efficiency and diminished local pollution when utilized in fuel cells, rendering it a feasible alternative to fossil fuels.
The evolution of Blue Hydrogen, integrating carbon capture technology, and Green Hydrogen, created from renewable energy options, is necessary for international decarbonization pursuits. The identification of natural hydrogen reservoirs further presents novel opportunities for clean energy production, potentially facilitating the decarbonization of energy-intensive sectors. Nevertheless, challenges persist, including elevated production costs and the necessity for robust infrastructure for storage and transportation. Surmounting these obstacles will necessitate effective policy frameworks and technological innovations, ensuring that hydrogen's role is complementary to other renewable technologies, particularly in addressing energy intermittency and storage challenges [10-16].
The global shift towards renewable energy constitutes a paramount initiative aimed at alleviating climate change and diminishing greenhouse gas emissions, with technologies such as solar energy, wind energy, and Helium Closed-Cycle Gas Turbines (HeCCGT) assuming essential roles. Solar energy, supported by rapidly decreasing costs and enhanced efficiency, has emerged as a fundamental element of renewable energy strategies globally. Solar power, driven by rapidly declining costs and increasing efficiency, has become a cornerstone of renewable energy strategies worldwide. Photovoltaic systems convert sunlight into electricity, making solar energy a clean and abundant source, though its production is limited to daylight hours, creating intermittency challenges.. Wind power, similarly, harnesses the natural movement of air to generate electricity and has seen significant growth, particularly in onshore and offshore wind farms, due to technological advancements and favourable policies aimed at reducing carbon emissions. However, like solar energy, wind power is also intermittent, with varying wind speeds across different seasons and times of day [17-21].
To address these fluctuations, backup systems such as HeCCGTs are essential. HeCCGTs use helium as a working fluid in a closed system, allowing for high-efficiency electricity generation by leveraging nuclear reactors or solar thermal energy as heat sources. These turbines provide reliable backup power, ensuring grid stability when renewable sources fall short, and can also be integrated with hydrogen production systems, using surplus renewable energy to generate and store hydrogen for later use. Together, these technologies—solar, wind, and HeCCGT—form a synergistic framework for reducing carbon emissions, enhancing energy security, and supporting a sustainable global energy transition [22-26].
As the global urgency for decarbonization intensifies, the need for substantial investments and comprehensive energy strategies has become more apparent than ever. These investments are not just financial but also strategic, aiming to sustain the progress achieved in reducing global poverty and ensuring continued economic development. Decarbonization involves more than just transitioning away from fossil fuels; it requires an integrated approach that includes renewable energy sources, technological innovation, and cross-border cooperation.The concept of global electricity interconnections, which fosters the sharing of renewable resources like solar and wind across different regions, is a significant component of this transition. This approach links environmental sustainability with sustained economic growth and the wise management of natural resources, illustrating the interconnectedness of these critical global priorities. In this context, oil-dependent economies are under pressure to pivot towards cleaner energy sources. This study is distinctive in its focus on the comprehensive decarbonization of an entire oil-exporting nation, a topic not widely explored in existing literature. While research has addressed decarbonization in certain industries like automotive, there is little examination of country-wide transitions. This work builds on that gap, exploring the shift from oil exports to hydrogen production through the integration of solar, wind, and HeCCGT technologies to achieve decarbonization [27-31].
Analysis Method
The analysis starts by organizing raw data on electricity demand and supply from solar, wind, and Helium Closed-Cycle Gas Turbines (HeCCGT) across different seasons, setting the stage for a detailed time-series analysis. This tracks fluctuations in energy production and consumption, helping to identify demand peaks, renewable energy variability, and the role of HeCCGT as a steady power source. The next step, supply-demand matching, compares energy produced by solar, wind, and HeCCGT to hourly demand, highlighting any shortfalls or surpluses. Scenario-based analysis follows, modeling different energy source combinations across seasons to illustrate system flexibility and the importance of a diverse energy mix for security. Efficiency and sustainability metrics are then calculated, measuring the performance of each energy source and its contribution to carbon reduction. A key part of the analysis examines the role of hydrogen, assessing its production during renewable energy surpluses, its storage, and usage across sectors, including in the Hydrogen Combined Cycle Gas Turbine (H2CCGT) system during power shortages. The effectiveness of hydrogen in stabilizing the grid and addressing renewable intermittency is evaluated.
To illustrate the results, the data are visualized through graphs and charts, which depict seasonal energy production versus demand, and the use of backup systems such as H2CCGT during deficits. Sensitivity analysis also tests the robustness of the system by adjusting variables such as demand and energy availability, ensuring its resilience under changing conditions. The method combines data analysis, scenario modeling, and visualization to assess how solar, wind, HeCCGT, and hydrogen backup systems can effectively drive decarbonization. The authors were unable to find such a comprehensive step-by-step analysis in existing research. To assist the country’s efforts to decarbonize its energy system, national and international data were carefully analyzed to forecast future energy requirements, examine daily consumption patterns, and evaluate the integration of renewable energy sources through time series analysis, scenario modeling, and efficiency assessment.
Decarbonization Strategies in Oil-Dependent Countries
Decarbonizing oil-dependent countries is a unique challenge, but it's also a huge opportunity. Many of these nations rely heavily on fossil fuels for their economies, but they’re recognizing the need to shift towards cleaner energy sources to address climate change and create more sustainable economies. One of the main strategies is transitioning to renewable energy. Countries like Saudi Arabia and the United Arab Emirates (UAE) are investing heavily in solar and wind power. Saudi Arabia, through its Vision 2030 plan, is working to diversify its energy sources and cut down on emissions by developing large-scale solar and wind projects. The UAE has also made significant strides, notably with its massive solar park projects like the Mohammed bin Rashid Al Maktoum Solar Park (REN21, 2020). These projects show that even oil-rich countries are starting to prioritize renewable energy as a path to a cleaner future [32-37].
Another approach is using carbon capture and storage (CCS) technology, which captures CO2 emissions from industries and stores them underground. Oil-dependent countries often have favorable conditions for this, thanks to their geological formations. Norway is leading the way with projects like Sleipner and Snøhvit, where CO2 from natural gas production is captured and stored beneath the seabed . This technology allows these nations to keep using fossil fuels while reducing their environmental impact. Developing a hydrogen economy is also seen as a promising solution. Hydrogen, especially when produced using renewable energy (green hydrogen), could play a significant role in clean energy for power generation, transportation, and industry. Countries like Saudi Arabia and the UAE are pouring resources into hydrogen production, aiming to be global leaders in this emerging market. Blending hydrogen with natural gas is one way these nations are slowly decarbonizing their energy systems while ensuring energy security [38-40].
Improving energy efficiency and pushing for electrification are also key elements of the decarbonization puzzle. Many oil-dependent nations, such as Kuwait and Qatar, are working on making their energy use more efficient across various sectors, from buildings to transport.Electrification, especially in transportation, is gaining traction as well. Oman and Bahrain are exploring electric vehicle infrastructure to help cut down on fossil fuel reliance. On a global scale, these countries are also taking part in international climate initiatives like the Paris Agreement. They’re working with organizations such as the International Renewable Energy Agency (IRENA) and the International Energy Agency (IEA) to create policies that support a low-carbon future. This collaboration helps them access the technology, financing, and expertise needed to make their energy transitions a reality [41-43].
The process of decarbonization in nations reliant on oil is inherently intricate, necessitating an amalgamation of advancements in renewable energy, the implementation of carbon capture technologies, the production of hydrogen, enhancements in energy efficiency, and the diversification of economies. Recent investigations conducted by various scholars elucidate the multifaceted challenges and potential benefits inherent in this transition, with particular emphasis on the Libyan context. Their 2023 research concentrated on the synergistic integration of hydrogen, wind energy, and gas turbine technologies, highlighting the extensive land utilization and infrastructural investment requisite for attaining energy autonomy and substituting oil exports with hydrogen. A subsequent 2024 investigation by the same researchers introduced an innovative methodology employing submersible power facilities equipped with closed-cycle helium gas turbines to further scrutinize these transitional dynamics [18] Additionally, another ongoing investigation by the same authors delves into the feasibility of amalgamating hydrogen, solar energy, and gas turbine technologies, with a pronounced focus on the substantial capital investments necessitated by such endeavours . The financial implications are also thoroughly analysed, with projections for solar, wind, and helium-cycle technologies estimated to range from several hundred billion to exceeding one trillion dollars. Collectively, these studies furnish a significant groundwork for policymakers and investors, underscoring the indispensable infrastructure and meticulous strategic planning necessary for the successful transition to a decarbonized economy within oil-exporting nations [44-46].
As mentioned in Section 1, this research is unique in the literature because it focuses on the decarbonization of an entire oil-exporting country—a subject that has not yet been extensively explored. Despite extensive searches, no studies have been found that examine the decarbonization of a whole country, though similar research exists in specific industries, such as the automotive sector. Building on this foundational work, the current study investigates the transition from oil exports to hydrogen production by leveraging solar, wind, and HeCCGT technologies, and examines how these technologies can be combined to effectively decarbonize an oil exporting nation. The comprehensive assessment presented here provides a critical assessment of the technological and economic implications associated with such a transition, emphasizing the need for significant investment and strategic foresight. The insights derived from this research are critical to guiding future policy formulation and ensuring effective implementation of decarbonization strategies within oil-exporting countries.
Decarbonization efforts in oil-dependent countries are inherently a diverse enterprise; however, they advance by integrating renewable energy innovations, decarbonization technologies, hydrogen production, energy efficiency improvements, and economic diversification. These frameworks not only help reduce carbon emissions, but also promise that these countries can evolve and succeed in a rapidly changing energy landscape.
Decarbonization Evaluations with Hydrogen Export
4.1 Energy Mix Analysis
Seasonal and hourly data highlight the contributions of solar, wind, and helium closed-cycle gas turbines (HeCCGT) to the overall energy mix in this study. Solar and wind peak during their respective seasons (solar in summer and wind in winter), 4.3 Carbon Emission Reduction: while H2CCGT provides backup power, filling the gaps left by intermittent renewables. The data suggest a critical role for HeCCGT in grid stability and reliability.
4.2 Scenario-Based Projections
Two main decarbonization scenarios are examined considering the available data: - Scenario 1: In this scenario, solar and wind are identified as major contributors to power, with H2CCGTs acting as a backup system to compensate for periods of low renewable generation. This scenario underscores the importance of hydrogen in aligning power generation with consumption and export. A notable aspect of this scenario is the expected production and export of hydrogen, with Libya expected to export 17.5 million tonnes of hydrogen (2,100 PJ) per year, reflecting Libya's current oil production levels. Excess energy generated during peak periods will be allocated to solar and wind power generation to produce hydrogen for export, thereby generating economic benefits while facilitating global decarbonization initiatives. - Scenario 2: This scenario envisions a comprehensive integration of HeCCGT with solar and wind power systems, thus eliminating the need to use H2CCGT as a backup system. In this configuration, HeCCGT, in combination with renewables, provides a more reliable and stable electricity supply. Hydrogen production and export remain central, with Libya continuing to produce 17.5 million tonnes of hydrogen (2,100 PJ) for annual export. This scenario highlights the potential to decarbonize the domestic electricity grid while estbalishing Libya as a leader in the global hydrogen export market.
4.3 Carbon Emission Reduction
This investigation seeks to develop a comprehensive roadmap for decarbonizing Libya by 2050, demonstrating a critical change for a nation that is largely dependent on fossil fuel supplies. As illustrated in the Libya Energy Consumption in 2020 as shown in figure 1, carbon-intensive sectors, including transportation, jet fuel, and domestic gas consumption, play a significant role in the country's CO2 emissions profile [47-50].
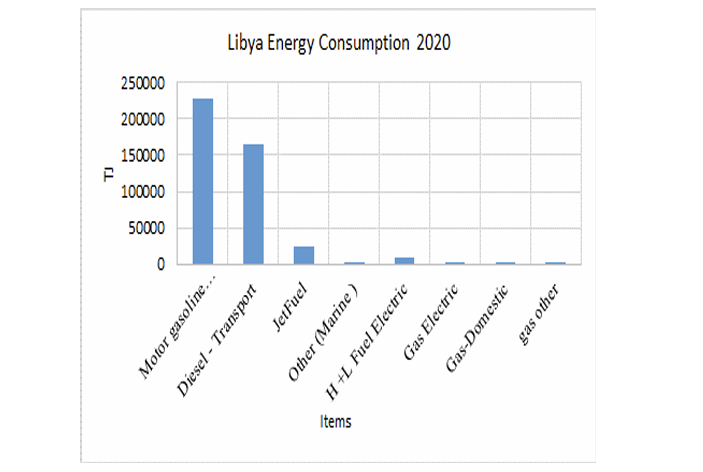
Figure 1: Libya Energy Consumption 2020
Libya intends to move away from its dependence on oil exports towards a future that highlights renewable energy, particularly solar, wind, and green hydrogen. The proposed decarbonization scenarios reveal the potential to mitigate carbon emissions by harnessing these renewable resources in conjunction with highly efficient combined cycle gas turbine (HeCCGT) systems for optimal power generation. By integrating renewable energy technologies, Libya intends to not only reduce its domestic carbon emissions but also make a meaningful contribution to global decarbonization initiatives through hydrogen exports. As the data presented suggests, sectors such as transportation, which currently account for a large share of energy consumption and emissions, are expected to benefit significantly from this shift towards green hydrogen. By moving away from sectors that produce high carbon outputs and embracing renewable energy alternatives, Libya can help other countries reduce their fossil fuel needs, while maintaining its commitment to net-zero emissions by 2050, and ensuring it remains an energy supplier in a more sustainable global context.
5.1 Energy Storage and Hydrogen Integration
The function of hydrogen as an energy storage mechanism is crucial for the decarbonization strategy outlined in both scenarios. The surplus energy generated by solar and wind during peak production periods is employed in the synthesis of green hydrogen. This hydrogen is then stored for use during energy deficits or exported to global markets. The production of 17.5 million tonnes of hydrogen (2100 PJ) for export constitutes a fundamental element of Libya’s strategic approach to harness renewable energy for economic advancement and to support global decarbonization efforts.
5.2 Projections for the Year 2050
This study contributes to Libya’s full transition to a renewable energy-based energy system, supported by solar, wind and HeCCGT, along with large-scale hydrogen production. Exporting 17.5 million tons of hydrogen (2100 PJ) per year will position Libya as a major source of clean energy, providing a sustainable economic future while contributing to global decarbonization efforts. This integrated approach to decarbonization combines the benefits of domestic energy stability with international market opportunities. Libya’s decarbonization strategy involves a complex but well-planned transition from a fossil fuel-dependent economy to a leader in renewable energy and hydrogen exports. The combination of solar, wind and HeCCGT, supported by hydrogen production, ensures that the country not only meets its own energy needs, but also contributes significantly to global decarbonization efforts by exporting 17.5 million tons of hydrogen (2100 PJ) per year. This strategy provides a roadmap for other oil dependent countries looking to transition to a green economy while maintaining economic growth and stability. Figure 2 shows current daily and seasonal consumption patterns to produce equivalent, carbon-free daily and seasonal consumption patterns for the year 2050 [47-50]. The year is assumed to consist of four seasons, each representing 91.25 “standard” 24-hour days. This step includes adjustments to ensure that daily and seasonal energy consumption patterns match the annual scenarios for Case 1 and Case 2.
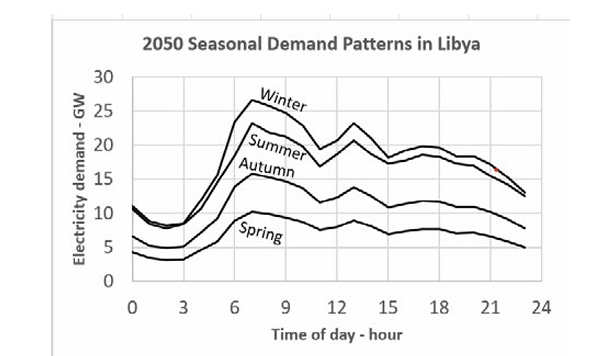
Figure 2: Demand Curves for 2050 Used in the Study
5. Decarbonization Baseline: Comparative Case Studies for Solar, Wind, and HeCCGT Integration with Hydrogen Export
This baseline represents a starting point for integrating three major electricity sources solar photovoltaics, wind, and helium-powered closed-cycle gas turbines-in two decarbonization scenarios. The first scenario focuses on combining solar and wind power while exporting 17.5 million tons of hydrogen annually. The second scenario combines helium-powered closed-cycle gas turbines with solar and wind power, also aiming to export 17.5 million tons of hydrogen. These scenarios aim to achieve net-zero carbon emissions, meet domestic energy demand, and support economic growth through hydrogen exports. The following analysis assesses the effectiveness of each energy source in achieving these goals i e e u ie r and lays the foundation for achieving decarbonization by 2050.
The baseline analysis focuses on three decarbonization case studies, each utilizing a different primary energy source: solar PV, wind energy, and HeCCGT. Figures 1 a, 3b, and 3c illustrate the performance of these energy sources during a typical summer day. The table accompanying these figures provides a detailed breakdown of the installed capacity, land area requirements, electrolyser capacity, hydrogen storage, and H2CCGT units needed to support both energy production and hydrogen export.
This baseline serves as the foundation for understanding the infrastructure and output needed to transition away from fossil fuels.

Figure 3a, b and c: comparative daily power generation and demand for solar, wind, and hecc in summer
In Figure 3a, the solar PV scenario shows how solar energy peaks during midday, generating nearly 500 GW of power when sunlight is at its maximum. However, this energy source is constrained by daylight hours, resulting in a gap between supply and demand during the night and early morning. The energy demand, represented by the dashed line, remains consistent throughout the day, highlighting the need for backup systems or energy storage to bridge the gap left by solar PV.

Table 1: Power Generation Capacity, Infrastructure, and Hydrogen Production Summary
Table 1 presents an extensive overview of the power generation capabilities, necessary infrastructure, and hydrogen production potential for three predominant energy sources: solar, enhanced solar, wind, and helium closed-cycle gas turbines (HeCCGT). Solar energy leads with an established capacity of 657 GW, necessitating 7,821 km² of land, bolstered by 491 GW of electrolyser capacity and significant hydrogen storage of 43,500 tons, in addition to 54 H2CCGT units for supplementary support. Wind energy, which has an installed capacity of 340 GW, demands a larger expanse of 37,325 square kilometers, alongside 298 GW of electrolyser capacity and 24,000 tons of hydrogen storage, supported by 44 H2CCGT units. Although the HeCCGT system exhibits a lower capacity of 130 GW, it possesses the advantage of ensuring consistent power generation, complemented by 120 GW of electrolyser capacity and 1,080 tons of hydrogen storage, without necessitating additional H2CCGT units [18,44,45,51].
The data presented in the table underscores the pivotal role that both standard and enhanced solar technologies play within the overarching energy generation framework. The solar power generation capacity stands at 657 GW, requiring 7,821 square kilometers of land. Notably, enhanced solar technology maintains the same capacity of 657 GW while achieving improved land utilization, decreasing the required area from an initial 12,100 square kilometers to 7,821 square kilometers. This signifies a substantial reduction in land utilization of approximately 35%, indicative of advancements in solar technologies that augment energy density and overall efficiency. The ramifications of this enhanced solar technology are substantial. By minimizing the land area necessary for equivalent energy output, Libya can optimize land utilization, particularly in regions where land availability poses a challenge. This increased efficiency also mitigates the ecological footprint associated with extensive solar farms, diminishing the necessity for large solar installations that could otherwise intrude upon critical ecosystems or agricultural zones. Furthermore, the reduced land demands facilitate more adaptable deployment of solar infrastructure, permitting integration of solar systems into urban or industrial locales where spatial constraints are present. Additionally, both configurations of solar contribute significantly to hydrogen production, with 491 GW of electrolyser capacity yielding 43,500 tons of stored hydrogen. The vast capacity for hydrogen storage highlights how crucial solar energy is in promoting hydrogen as a sustainable energy transport medium, which is key for reducing carbon emissions in areas like transport and heavy manufacturing. The presence of 54 H2CCGT modules associated with both solar systems exemplify the dependability of solar energy in furnishing stable, dispatchable power even in the absence of sunlight.

Table 2: Solar PV System Performance and Land Use Overview
The solar energy system begins with a nominal installed capacity of 657 GW, which represents the maximum potential output under ideal conditions. However, several real-world factors reduce this theoretical capacity. Availability, contingency, and fouling, each with high values of 0.98 and 0.97, account for operational downtimes such as maintenance, which is often performed at night to minimize disruptions. After considering these factors, the available output is adjusted to 612.1 GW. Additionally, a weather factor of 0.833 is applied, based on the assumption that the region experiences 300 days of sunlight annually. This reduces the effective output to 509.8 GW, which reflects the impact of varying weather conditions on solar generation. The efficiency of the PV cells, at 14%, determines how much of the sunlight is converted into electricity, while the system's total installation requires an extensive land area of 7821 km². This includes the 0.6 fraction of the space occupied by the PV panels themselves. Together, these factors provide a realistic estimation of the solar energy system's actual output, considering both environmental and operational conditions as shown in table 2.
Figure 3b shows wind power as the primary energy source. Wind power shows a different pattern than solar power, with peak generation occurring in the early morning and evening. Wind power produces up to 150 GW in the summer season while peaking in the winter, generating about 311 GW of power when wind speeds are at their peak, but its variability is evident throughout the day. While wind power complements solar power by generating power during peak solar hours, it still struggles to meet the constant energy demand shown by the dotted line. Table 1 shows that 340 GW of wind power has been installed, requiring a vast land area of 37,325 km2. To achieve the hydrogen export targets, 298 GW of electrolyser capacity is needed, along with 24,000 tons of hydrogen storage. In this scenario, 44 H2CCGT units provide backup power when wind power is insufficient, especially during periods of low wind speed.

Table 3: Wind System Performance and Land Use Overview
Table 3 provides an overview of the factors affecting wind energy generation. Starting with a nominal wind capacity of 340 GW, the actual available wind power is adjusted through several operational factors. The wind factor (0.0445), maintenance efficiency (0.90), and fouling adjustment (0.97) reduce the nominal capacity, resulting in an available wind generation capacity of 305.3 GW. Additionally, the wind power factor (1.6327) and the area factor influence the final layout of the wind turbines, requiring 9.109 km² of space for turbines and a total land area of 37,325 km² for the entire wind energy setup.
Figure 3c shows the HeCCGT scenario, where the helium-fired closed-cycle gas turbine provides a stable and reliable power output of 120 GW all day long in summer, while its cycle in winter is 130 GW, depending on the seawater temperature. Unlike solar and wind power, the HeCCGT is not affected by external conditions, providing continuous power that matches the ongoing energy demand. This makes the HeCCGT an essential component for ensuring energy stability, especially when renewable sources are not available. The table indicates the installation of 130 GW of HeCCGT capacity, with much lower ground requirements compared to solar and wind power. The electrolyzer capacity required for hydrogen production in this scenario is 120 GW, with 1,080 tons of hydrogen stored annually. It is worth noting that the HeCCGT system does not require any additional HeCCGT backup units due to its reliable output.

Table 4: Helium Closed Cycle System Performance Use Overview
Table 4. provides an insight into the performance of the HeCCGT system. With a nominal capacity of 130 GW, the system operates at 95% availability, providing an available power output of 123 GW. The system performance is consistent across seasons, with slight variations: 125.5 GW in winter, 122.99 GW in spring and autumn, and 120.5 GW in summer. The total number of 1 GW modules required for this setup is 130, ensuring a stable and reliable power supply throughout the year.
Case Studies 1
Case Studies 1 engages in a comprehensive examination of decarbonization strategies through the strategic incorporation of renewable energy resources. Within this context, solar and wind stand out as key energy sources, assessed for their joint impact on lowering carbon emissions and advancing energy sustainability. These case studies systematically assess the operational efficacy, capacity, and infrastructural prerequisites of solar and wind power generation in fulfilling energy demand while simultaneously facilitating the production and export of hydrogen as a viable clean energy carrier. The principal aim is to evaluate the collaborative functionality of solar and wind energy in establishing a resilient, decarbonized energy system, with hydrogen combined cycle gas turbines (H2CCGT) functioning as an auxiliary solution when solar and wind resources are inadequate.
7.1 Balancing Energy Demand with Solar, Wind, and H2 CCGT Systems for Four Seasons
The analysis provides a detailed explanation of energy production and consumption patterns across different seasons – winter, spring, summer and fall – with a focus on the integration of solar, wind and hydrogen energy systems. This analysis helps identify energy surplus or deficit for each hour of the day and shows how hydrogen is produced, stored and used to balance the energy grid.
7.2 Analysis for the Winter Season
The examination of the Winter season data provides a comprehensive analysis of the equilibrium between energy production and management, utilizing a hybrid of solar and wind energy, with hydrogen serving an integral function in upholding grid stability as shown in Table 5. The dataset initiates with solar irradiance (Column 1), quantified in watts per square meter (w/ m²). During the Winter season, the maximum solar irradiance is recorded at 12 PM, attaining a value of 669 w/m², which corresponds to the zenith of solar power generation at 18 GW (Column 2). This solar input, albeit restricted to diurnal hours, is of paramount importance during its optimal operational periods.
Wind density (Column 4), articulated in kilowatts per square meter (kW/m²), remains consistently elevated throughout the diurnal cycle, which is crucial for the reliability of wind energy generation. The dataset indicates that wind power reaches its apex at 284 GW around midnight (Column 5), rendering it a dependable energy source, particularly during nocturnal hours when solar energy is non-existent. This constancy in wind energy contribution facilitates the overall power generation (Column 6) to maintain relative stability, with the highest total output of 293 GW occurring at 8 AM, amalgamating both solar and wind inputs. This culminates in the maximum total energy output (Column 7) of 1056 terajoules (TJ) at 9 AM, illustrating the synergy between the two energy sources in fulfilling demand.
Conversely, energy demand (Column 8), which reaches its zenith at 27 GW at 7 AM, generates a substantial energy requirement of 96 TJ during the corresponding hour (Column 9). Despite these peaks in demand, the system adeptly orchestrates an energy surplus, with the most significant surplus of 979 TJ manifesting at 8 AM (Column 10). This surplus is vital as it facilitates the generation of hydrogen, as depicted in Column 12, where the peak hydrogen production is recorded at 646 TJ, translating into 5382 tonnes of hydrogen (Column 13) at 9 AM.
The proficient storage and exportation of hydrogen are further emphasized within the dataset. Hydrogen storage reaches its apogee at 13,393 tonnes at midday (Column 16), guaranteeing an adequate reserve for periods of diminished energy output. This stored hydrogen is also allocated for export, with the maximum export level of 9,239 tonnes occurring at 3 AM (Column 17), exemplifying the system's capability to cater to both domestic energy requirements and generate economic advantages through hydrogen exports.
Notably, the dataset reveals an absence of necessity for the deployment of H2CCGT units (Columns 19 and 20) during the Winter season, highlighting the sufficiency of wind and solar energy in addressing demand without supplementary backup. This is corroborated by the electrolyser capacity (Column 21), which peaks at 276 GW at 2 AM, demonstrating the system’s efficacy in transforming surplus energy into hydrogen during periods of excess availability.
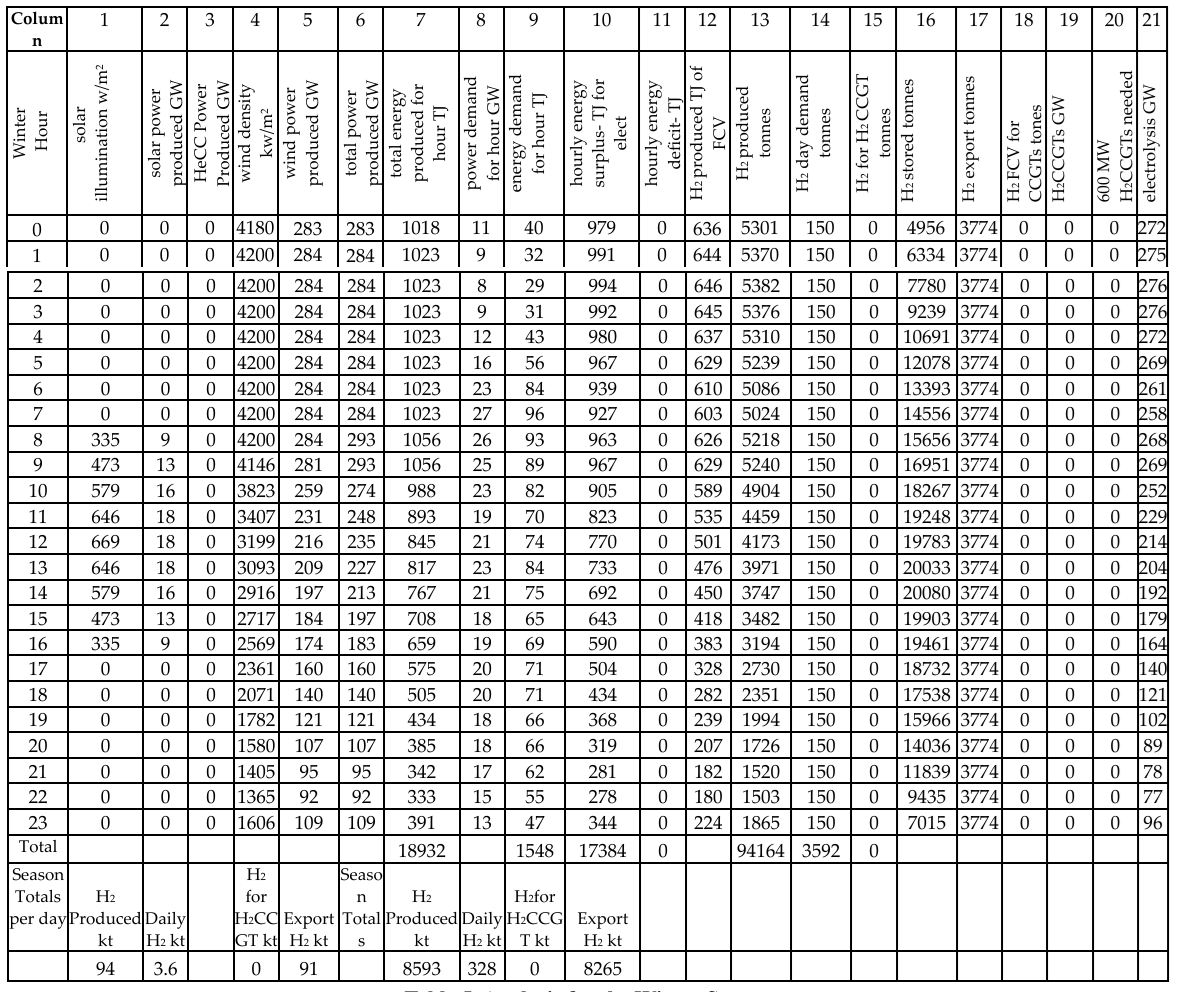
Table 5. Analysis for the Winter Season
7.3 Analysis for the Spring Season
Table 6 shows that the spring solar energy data show a distinct dynamic when compared to winter, characterized by an increase in solar energy production due to the longer daylight hours and the intensification of solar radiation. Solar radiation (column 1) peaks at 906 W/m² at 12 noon and reaches a peak solar energy production of 25 GW (column 2) during the corresponding hour. This improvement in the solar energy contribution is significantly significant in contrast to winter, where solar energy assumed a more restricted role.
Wind energy (Columns 4 and 5) persists as a reliable source of energy, with the apex of wind power generation documented at 191 GW at 11 AM. While wind energy continues to exhibit reliability, its contribution is marginally diminished relative to Winter, owing to generally more tranquil wind conditions during the Spring. At 12 PM, the joint force of solar and wind energy reaches a high of 215 GW in total power output, which equals 774 terajoules of generated energy.
Energy demand (Columns 8 and 9) during the Spring season is typically lower than that observed in Winter, with the peak demand reaching 10 GW at 7 AM, resulting in an energy requirement of 37 TJ. Notwithstanding this diminished demand, the energy surplus (Column 10) remains robust, characterized by a peak surplus of 746 TJ at 11 AM, thereby facilitating significant hydrogen production. Hydrogen production (Columns 12 and 13) is notably vigorous in the Spring season, with the highest output recorded at 485 TJ, which translates to 4043 tonnes of hydrogen at 11 AM. This surplus production guarantees the maintenance of hydrogen storage (Column 16) and export (Column 17) levels, with 16,313 tonnes stored and 10,051 tonnes exported by the conclusion of the day.
Analogous to the Winter season, there exists a negligible reliance on H2CCGT units (Columns 19 and 20) during the Spring, reflecting the sufficiency of solar and wind energy in fulfilling the demand. The capacity of electrolysers (Column 21) peaks at 207 GW at 11 AM, signifying the effective conversion of surplus energy into hydrogen.

Table 6: Analysis for the Spring Season
7.4 Analysis for the Summer and Autumn Season
The Summer and Autumn seasons present markedly different patterns of energy generation and consumption in comparison to Winter and Spring, predominantly attributable to fluctuations in solar irradiance and wind energy availability as shown in Table 7 and 8.
Summer Season: During the Summer season, solar energy assumes an increasingly significant role, with solar irradiance (Column 1) reaching a zenith of 999 w/m² at 12 PM. This phenomenon culminates in the apex of solar energy production at 27 GW during the identical hour (Column 2), which is substantially greater than the outputs recorded in Winter and Spring. Conversely, wind energy (Column 5) experiences a marked reduction, with the maximum observed wind energy generation being merely 156 GW at 5 PM, indicative of generally more tranquil wind conditions prevalent during the Summer.
Despite the augmented solar energy production, energy consumption (Columns 8 and 9) concurrently escalates, peaking at 23 GW at 7 AM, which corresponds to an energy requirement of 84 TJ. This heightened demand, primarily driven by cooling requirements, results in diminished energy surpluses (Column 10), with the highest surplus recorded at 197 TJ at 1 PM, which is significantly lower than the surpluses observed during Winter and Spring.
Hydrogen generation (Columns 12 and 13) remains considerable, achieving a peak of 339 TJ, translating to 2822 tonnes of hydrogen at 5 PM. Nonetheless, the curtailed surplus energy implies that the levels of hydrogen storage and exportation are correspondingly reduced, with 7,580 tonnes stored and 4,466 tonnes exported by the close of the day.
Fall Season: The Fall season witnesses a reduction in both solar and wind energy outputs in comparison to the Summer. Solar irradiance (Column 2) attains a peak of 906 w/m², leading to a maximum solar energy production of 25 GW (Column 3), comparable to Spring yet inferior to Summer. Wind energy (Column 5) remains at a moderate level, with the highest production registered at 146 GW at 5 PM.
Energy consumption (Columns 8 and 9) during the Fall is marginally lower than that of Summer, with the peak demand reaching 16 GW at 7 AM, equating to an energy utilization of 57 TJ. This diminished demand facilitates an increased energy surplus (Column 10), peaking at 594 TJ at midnight, which bolsters ongoing hydrogen production.
Hydrogen production (Columns 12 and 13) during the Fall is vigorous, achieving a peak output of 344 TJ, which converts to 2864 tonnes of hydrogen at 4 PM. The levels of hydrogen storage and exportation are sustained, with 6,867 tonnes stored and 3,336 tonnes exported by the conclusion of the day.
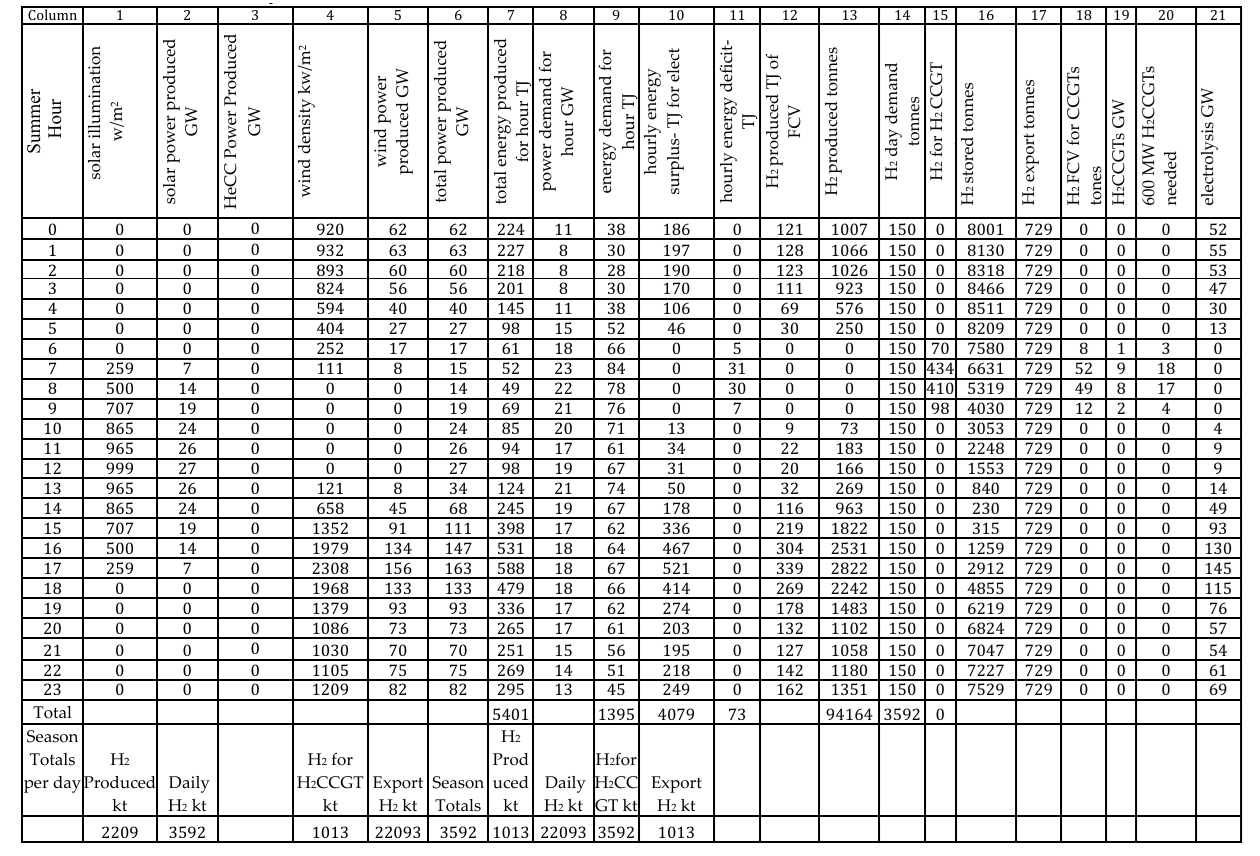
Table 7: Analysis for the Summer Season
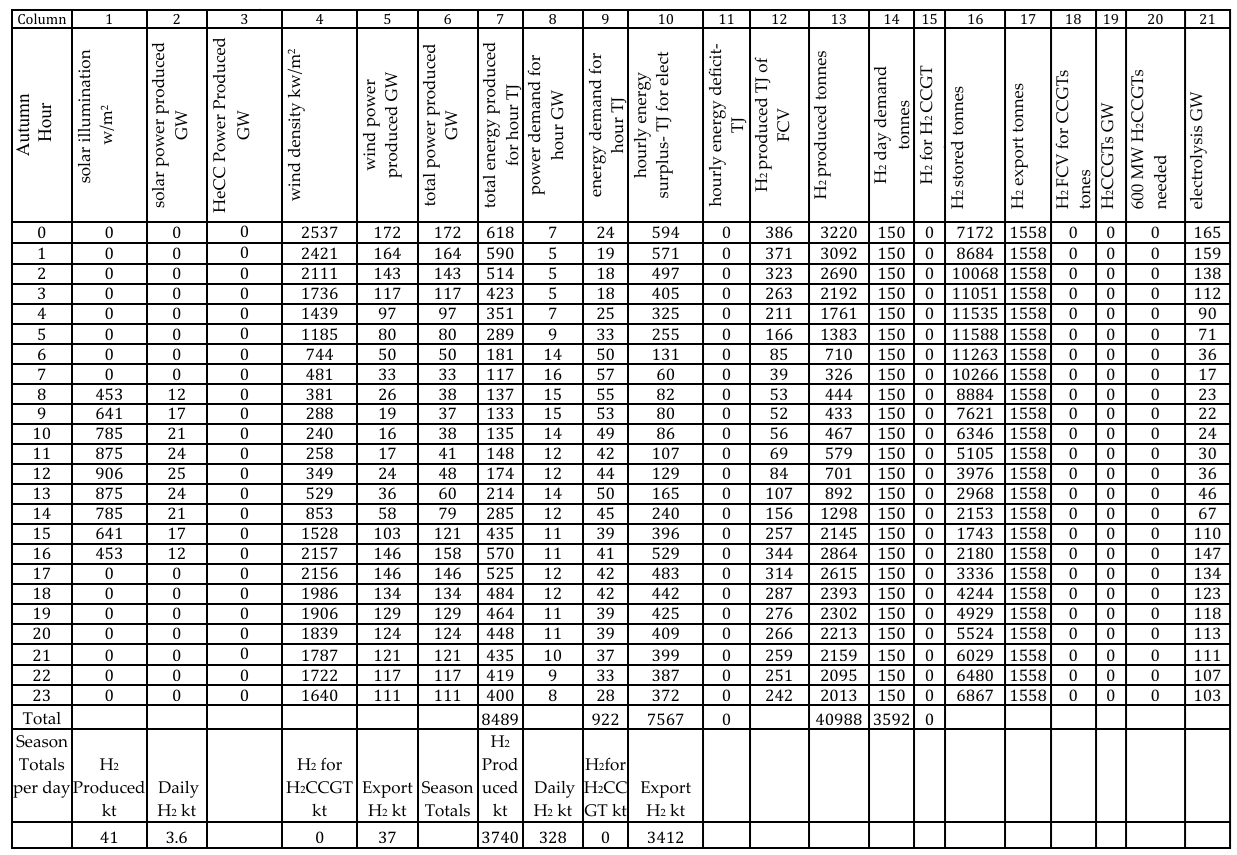
Table 8: Analysis for the Summer Season
8.1 Maximizing the Efficiency of Solar and Wind Combination for Economical
The Tables 9 and 10 presented elucidate the iterative modifications of the nominal Photovoltaic (PV) GW and Wind GW variables, aimed at optimizing the energy composition while concurrently satisfying both domestic energy requirements and the export objective of 17.5 million tons of hydrogen annually (corresponding to 2100 PJ). The investigation was conducted under two distinct cost paradigms: the conventional pricing of solar PV and an alternative scenario wherein solar PV costs were diminished by 50%. The primary objective in both scenarios was to ascertain the most economically efficient amalgamation of solar and wind energy while concurrently minimizing the overall expenses associated with fulfilling the energy requirements and hydrogen export objectives.
8.2 At Standard Cost of Solar PV
In the initial scenario, characterized by the standard pricing of solar PV, a variety of combinations of solar and wind energy were scrutinized. For example, in the configuration of high solar and low wind (471 GW Solar, 70 GW Wind), the electrolyser capacity was established at 359 GW, necessitating a transmission capacity of 541 GW and hydrogen storage of 34,000 tonnes. This combination, while achieving the requisite energy production and export targets, culminated in the highest aggregate cost of 916 billion USD. As the equilibrium between solar and wind energy was altered, with an increase in wind energy and a corresponding reduction in solar (e.g., 330 GW Solar, 140 GW Wind), the total costs commenced a decline, reaching 799 billion USD. These adjustments exemplify an optimization approach that seeks to reconcile the elevated infrastructural expenses associated with solar energy against the more economically viable wind energy. In the scenario where wind energy was maximized and solar energy minimized (75 GW Solar, 270 GW Wind), the total cost further diminished to 625 billion USD, highlighting the substantial cost efficiencies attainable by favouring wind energy under the standard solar PV cost conditions.

Table 9: Analysis of Standard Solar Panel Costs for Solar-Wind Power Combination
Based on Figures 4 a-b as well as Table 9, the examination elucidates a definitive correlation between the integration of solar and wind energy resources and the requisite infrastructure, alongside the associated costs necessary to fulfil decarbonization objectives, which include the exportation of 17.5 million tons of hydrogen annually (equivalent to 2,100 petajoules). Figure 4a illustrates the variations in total installed power generation, electrolyser capacity, transmission necessities, and hydrogen storage requirements as the contribution of wind energy escalates. As the capacity of wind energy expands, there is a marginal decline in total installed power generation and related infrastructure demands, signifying efficiency improvements. This pattern indicates that an equitable amalgamation of wind and solar energy is paramount to optimizing the energy system and diminishing infrastructure expenditures. Figure 4b concentrates on the overarching cost ramifications of the solar and wind energy combination. It demonstrates that the costs associated with power generation diminish as the proportion of wind energy elevates, with the most economical outcomes arising when the system is predominantly reliant on wind. This reduction is especially pronounced when juxtaposing the exclusive solar scenario with a more equitable or wind-centric blend. The prospects for economic viability from unifying wind and solar energy sources are unmistakable, since the total costs of a dual solar-wind operation are significantly less than those of systems that depend fully on either wind or solar power.
The corresponding table detailing standard solar photovoltaic costs corroborates these findings. It indicates that as the system transitions from a predominance of solar to a predominance of wind, the requirements for installed power, transmission, and hydrogen storage diminish, along with the quantity of H2CCGT units necessitated. This transition also culminates in a notable abatement in the total expenditure of a combined solar-wind system, with the most financially advantageous solution identified in the scenario exhibiting the highest wind contribution.
Significantly, such an analysis accentuates the critical necessity of optimizing the equilibrium between solar and wind energy to mitigate infrastructure costs and enhance efficiency in satisfying domestic energy demands and hydrogen export objectives.
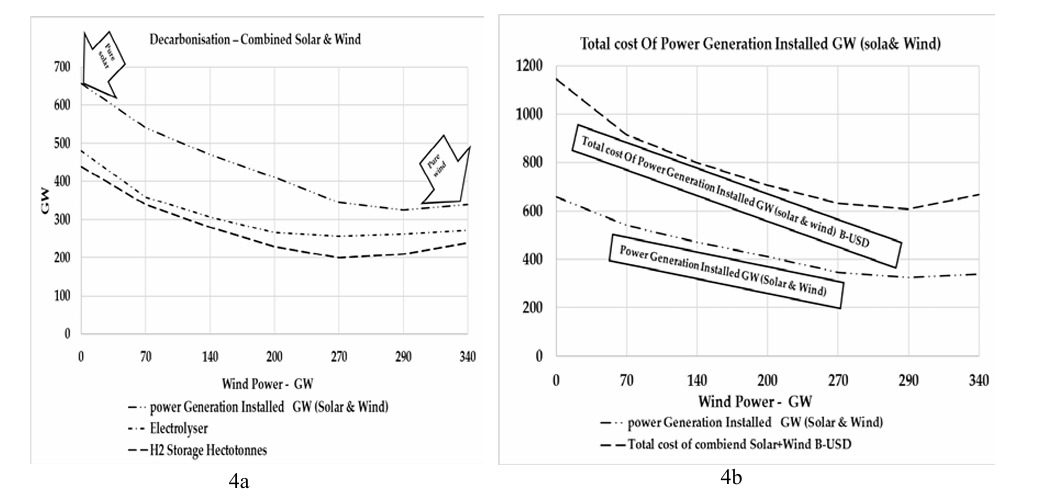
Figure 4 A-B: Decarbonization - Solar and Wind Combined
8.1 Impact Of 50% Cost Reduction of Solar PV on Combined Wind and Solar Systems
Table 10 and Figure 4- a,b provide a comprehensive analysis of the ramifications associated with a 50% diminution in solar photovoltaic (PV) costs concerning the overarching infrastructure and financial implications tied to a synergistic solar and wind power generation system aimed at fulfilling the hydrogen export objective of 17.5 million tons annually. The table delineates various configurations of solar and wind capacities, complemented by the requisite specifications for electrolyser capacity, transmission capacity, hydrogen storage, and hydrogen combined cycle gas turbine (H2CCGT) units. Furthermore, it encapsulates the cumulative total expenditure expressed in billions of United States dollars. In the figure, two distinct curves illustrate the total expenditures correlated with varying degrees of total installed power generation (measured in gigawatts), juxtaposing the initial standard solar PV cost against the 50% diminished solar PV cost. The dotted line signifies the standard solar PV cost scenario, while the dashed line represents the scenario incorporating the reduced solar PV cost.

Table 10: Analysis of 50% PV panel Costs for Solar-Wind Power Combination
The analysis reveals that a 50% reduction in solar PV costs engenders substantial cost efficiencies across all scenarios examined. For instance, in the scenario encompassing 471 GW of solar and 70 GW of wind, the total expenditure decreases from $916 billion under the standard PV costs to $628 billion under the reduced PV costs. The minimum cost observed in the scenario with a 50% reduction in PV costs is $576 billion, attained with a configuration comprising 211 GW of solar and 200 GW of wind.
This analysis substantiates the notion that a reduction in solar PV costs catalyses significant declines in overall system costs, rendering solar-centric configurations increasingly economically viable. A combined solar and wind strategy, coupled with a 50% reduction in solar PV costs, consistently yields the most favourable cost outcomes while preserving the requisite infrastructure to satisfy hydrogen export targets.
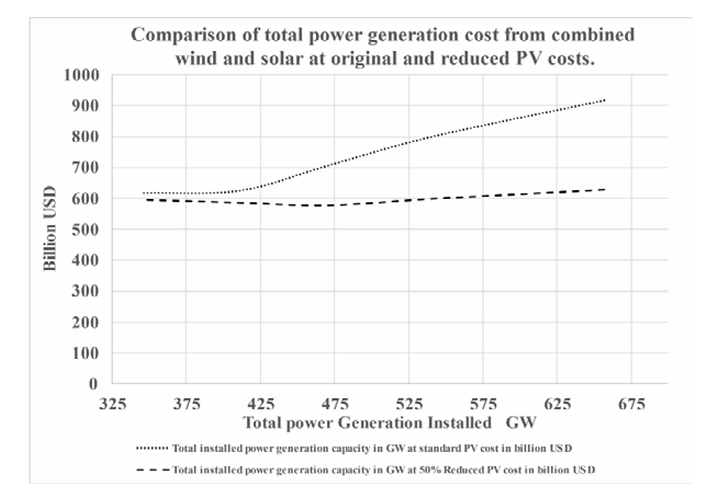
Figure 5: Comparison of total Power Generation Cost
8.1 Case Studies 2 Integrating Wind, Solar, And HeCC
examine comprehensive decarbonization strategies through the strategic integration of renewable energy resources (wind and solar) and closed helium cycles. In this context, solar, wind and compressed helium energy emerge as key energy sources, and their combined impact on reducing carbon emissions and enhancing energy sustainability is evaluated. These case studies assess the operational effectiveness, capacity and infrastructure requirements of solar, wind and compressed helium power generation in meeting energy demand while simultaneously facilitating the production and export of hydrogen as a viable clean energy carrier. The main objective is to evaluate the collaborative functions of solar, wind and compressed helium energy in creating a flexible and carbon free energy system, where hydrogen combined cycle gas turbines (H2CCGT), which were an auxiliary solution when solar and wind resources were insufficient in the first scenario, are eliminated.
8.2 Winter Season Analysis
During the winter season, the energy infrastructure is predominantly dependent on wind energy owing to the restricted solar irradiance, as demonstrated in Table 11. Solar energy achieves a moderate peak of 21 GW when irradiance ascends to 669 W/m² at noon. Conversely, wind energy delivers a consistent and substantial contribution, reaching a zenith of 216 GW, thereby maintaining the overall power generation stability. The highest total energy generation for a one-hour interval is documented at 911 TJ at 08:00 hours. The energy requirement during the winter months surges in the early morning hours, attaining 96 TJ, yet the system reliably generates an energy surplus, with the most significant surplus of 834 TJ recorded at 00:00 hours. This surplus facilitates considerable hydrogen production, with a peak output of 542 TJ, equating to 4516 tonnes of hydrogen at midnight. The proficient management of hydrogen storage is also observable, with storage capacities escalating to 13,393 tonnes by midday. Additionally, hydrogen exports reach a pinnacle of 9,239 tonnes at 03:00 hours, signifying the system's proficiency in producing surplus energy for hydrogen exportation. Importantly, the incorporation of compressed helium energy effectively obviates the necessity for Hydrogen Combined Cycle Gas Turbines (H2CCGT), showcasing the system's adeptness in addressing winter energy requirements exclusively through wind, solar, and helium storage.
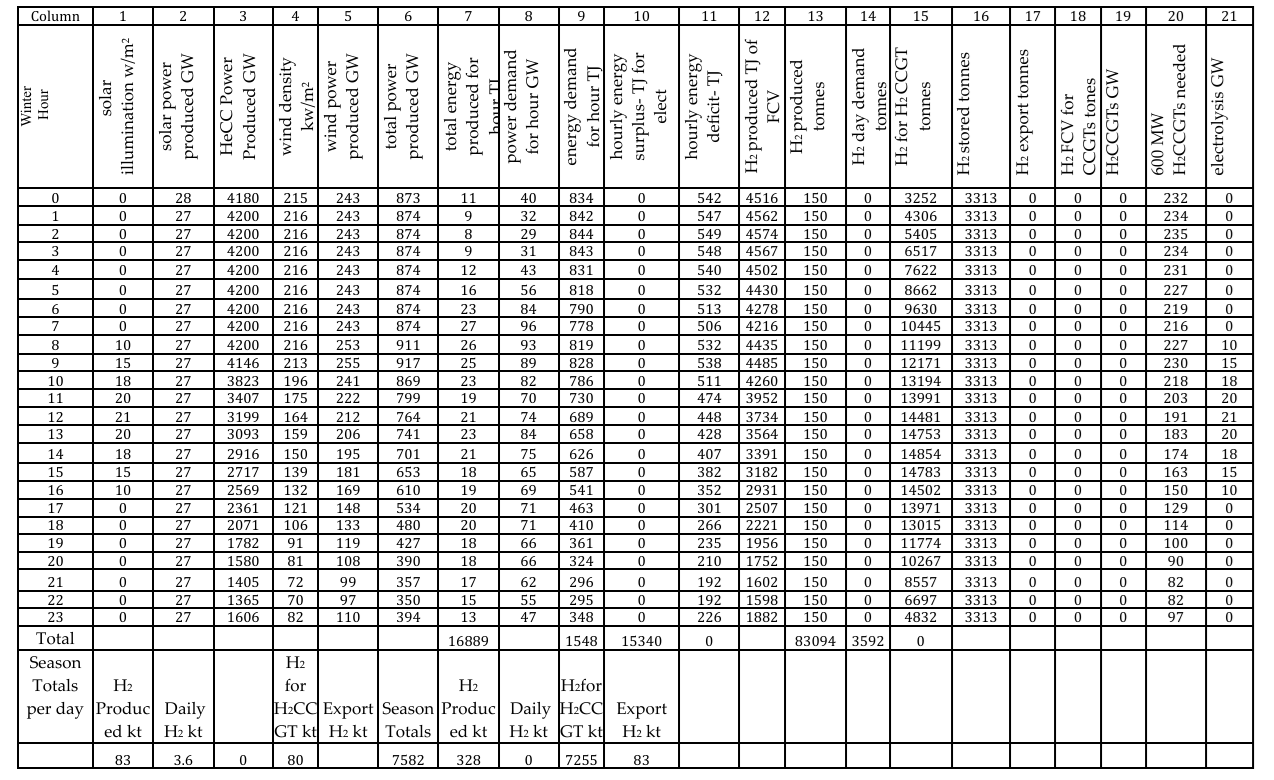
Table 11. Analysis for the Winter Season
8.3 Spring Season Analysis
The vernal season experiences advantages from an augmentation of daylight duration, as illustrated in Table 12, culminating in an elevation of solar irradiance, which attains a zenith of 906 W/m² at solar noon, thereby facilitating the generation of solar power up to 28 GW. The contribution of wind energy remains pivotal, albeit with a marginal decrease relative to the winter months, exhibiting a maximal output of 145 GW at noon. Cumulatively, the total energy generation reaches 199 GW during peak operational hours, translating into an hourly energy yield of as much as 774 TJ. The energy consumption during spring is comparatively diminished in relation to winter, peaking at 37 TJ at 7 AM. The energy surplus in the spring season is also noteworthy, peaking at 746 TJ at 11 AM, which enables considerable hydrogen production, amounting to 447 TJ (4043 tonnes) at the same hour. The infrastructure for hydrogen storage and export is effectively upheld, with peak storage capacity reaching 16,313 tonnes and export quantities at 10,051 tonnes by the conclusion of the day. The compressed helium energy system continues to function proficiently, thereby obviating the necessity for H2 CCGT units, highlighting the system's operational efficiency, which relies solely on solar and wind energy inputs throughout the spring season.
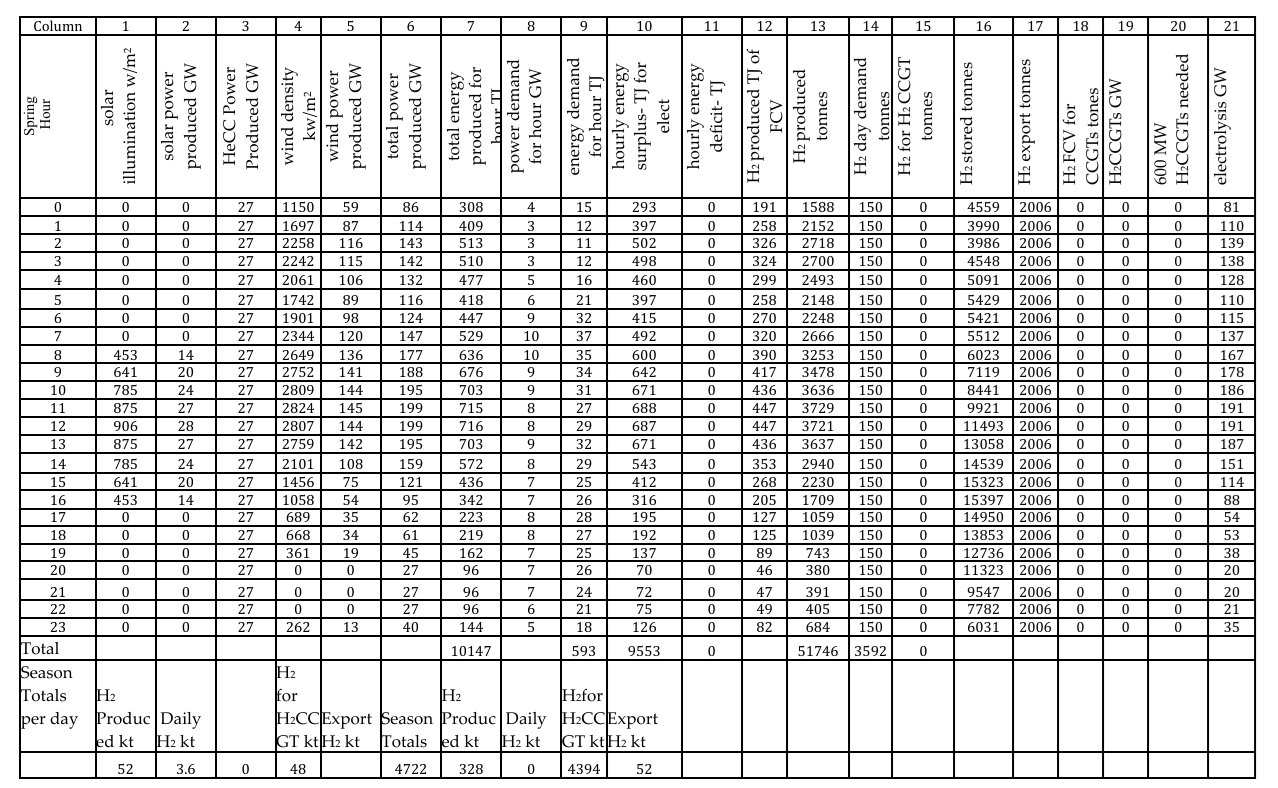
Table 12: Analysis for the Spring Season
8.4 Summer Season Analysis
As delineated in Table 13, the summer season witnesses the prominence of solar energy attributable to heightened solar irradiance, which attains a zenith of 999 W/m² at noon, culminating in a maximal solar power generation of 31 GW. The contribution of wind power is diminished during the summer months, exhibiting a peak output of 156 GW in the late afternoon. The overall energy production reaches its apex during midday, with a cumulative energy total of 515 TJ recorded at 4 PM. Nevertheless, the energy surplus during the summer is inferior to that of other seasons, with the most substantial surplus documented at 245 TJ at 2 PM. In spite of the diminished surplus, hydrogen production remains vigorous, peaking at 314 TJ (equivalent to 2615 tonnes) at 5 PM. The management of hydrogen storage and export levels is executed proficiently, with 7,580 tonnes retained and 4,466 tonnes dispatched by the conclusion of the day. The system's dependency on compressed helium serves to offset the reduced output of wind power, thereby ensuring grid stability and obviating the necessity for H CCGTs throughout the summer.
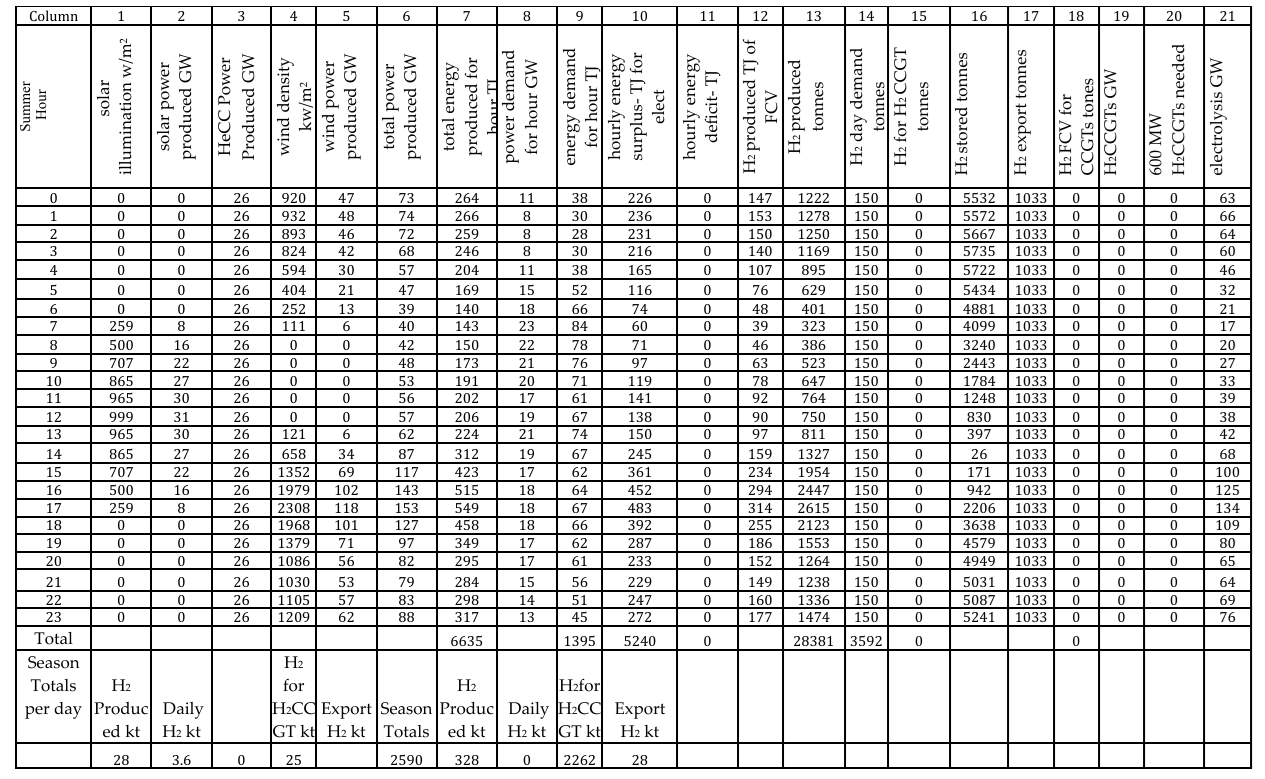
Table 13: Analysis for the Summer Season
8.5 Autumn Season Analysis
During the autumn season, the energy system undergoes an adaptation to the diminishing availability of solar and wind energy, as illustrated in Table 14. Solar irradiance attains a zenith of 906 W/m², facilitating the generation of up to 28 GW of solar power. Wind energy reaches a maximum output of 146 GW in the late afternoon, thereby contributing to an aggregate power generation of 545 TJ by 4 PM. The energy demand experienced in autumn is marginally lower compared to that of summer, with a peak demand of 57 TJ recorded at 7 AM. This reduced demand culminates in a more stable energy surplus, which peaks at 504 TJ by 4 PM. The production of hydrogen is effectively sustained, achieving a peak of 328 TJ (equivalent to 2730 tonnes) by 4 PM. The system adeptly manages the storage and export of hydrogen, with a maximum storage capacity of 6,867 tonnes and total exports amounting to 3,336 tonnes by the end of the day. Furthermore, the incorporation of compressed helium energy guarantees the seamless functionality of the system in the absence of H CCGT units, notwithstanding the decline in available solar and wind resources.
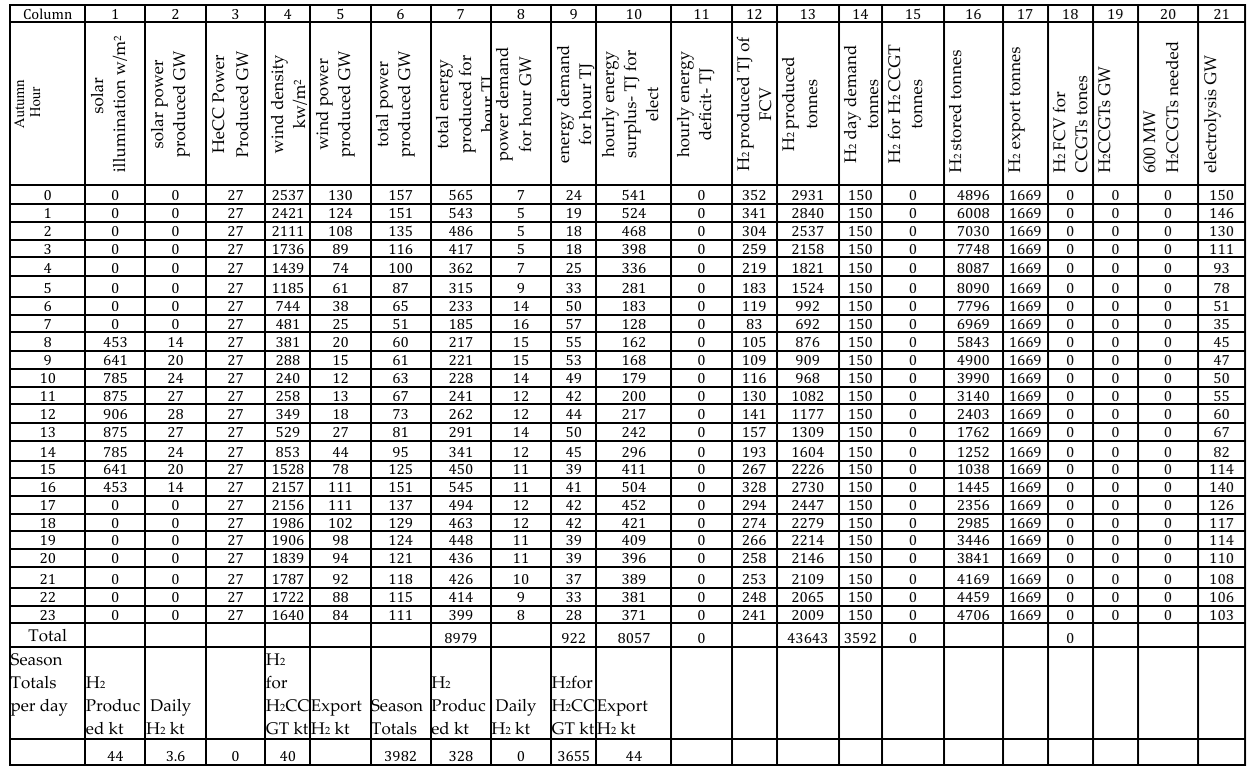
Table 14: Analysis for the Autumn Season
9.1 Enhancing the Integration of Solar, Wind, and HeCC for Efficient Hydrogen Generation and Export at Minimal Costs
The subsequent examination investigates the integration of solar, wind, and HeCC (Hybrid Energy Conversion Cycle) power generation systems to fulfil the dual objective of addressing domestic energy demands and facilitating the export of 17.5 million tons of hydrogen on an annual basis (which is equivalent to 2100 PJ). This investigation was undertaken within two distinct cost scenarios: the prevailing standard cost associated with solar photovoltaic technology and an alternative scenario wherein solar PV costs are diminished by 50%. The primary aim is to ascertain the most economically advantageous combination of solar, wind, and HeCC energy sources while concurrently minimizing the aggregate infrastructure expenditures necessary to achieve both energy production and hydrogen exportation goals.
9.2 Cost Analysis Under Standard Solar PV Pricing
In the initial scenario, which presupposes conventional pricing for solar photovoltaic (PV) systems, diverse configurations encompassing solar PV, wind, and hydrogen electrolysis carbon capture (HeCC) power generation were scrutinized. Table 15 provides a comprehensive overview of these configurations alongside their respective financial implications. For instance, in a configuration predominantly reliant on solar energy with negligible wind contribution (475 GW Solar, 0 GW Wind, and 28 GW HeCC), the requisite electrolyser capacity is determined to be 365 GW, accompanied by a transmission capacity of 503 GW and hydrogen storage spanning 31,000 hectares. This arrangement culminates in an aggregate system expenditure of 817 billion USD.
As the ratio of wind energy escalates, concomitant with a reduction in solar capacity, the overall costs commence a downward trend. For instance, with 276 GW of solar, 100 GW of wind, and 28 GW of HeCC, the cumulative cost is diminished to 646 billion USD. The scenario exhibiting the most favourable cost is identified when wind energy is maximized and solar energy is minimized (78 GW Solar, 200 GW Wind, and 28 GW HeCC), which yields a total expenditure of 499 billion USD. This analysis underscores the substantial economic advantages realized by enhancing the share of wind energy within the composite power generation portfolio.
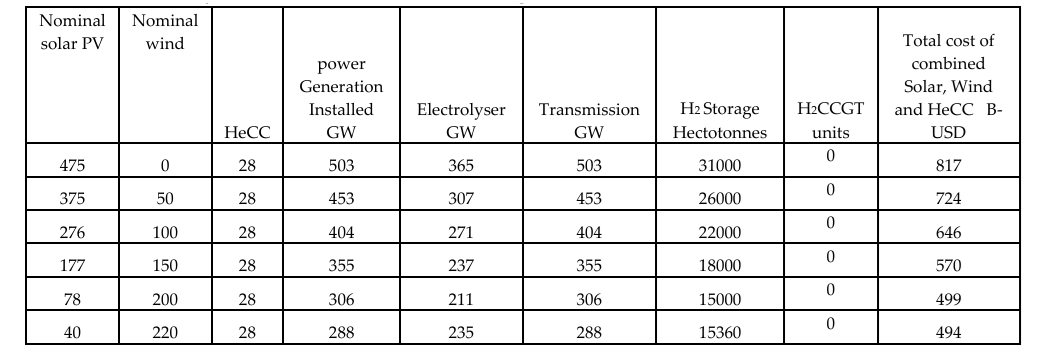
Table 15: Cost Analysis of Solar-Wind-HeCC Power Integration at Standard Solar PV Prices
As depicted in Figures 6a and 6b, a discernible trend emerges, demonstrating that an augmentation in wind energy leads to a concomitant decrease in the overall infrastructure requirements and associated costs. This trend accentuates the necessity of achieving a harmonious balance between solar and wind energy to optimize the energy system, thereby facilitating cost efficiencies in both hydrogen production and exportation.
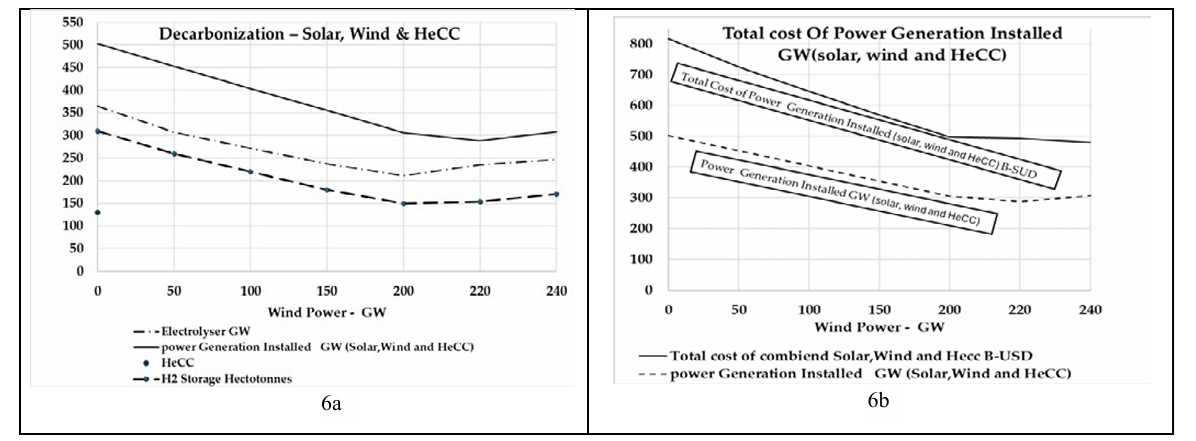
Figure 6 a-b: Decarbonization – Solar, Wind and HeCC.
Figure 6 a-b: Decarbonization – Solar, Wind and HeCC.
Table 16 and Figure 7 present a comprehensive analysis concerning the ramifications of a 50% reduction in solar PV expenditures on the cumulative system costs and infrastructure necessities pertinent to integrated solar, wind, and HeCC power generation. The table delineates a range of scenarios, emphasizing the total installed power generation capacity, electrolyser specifications, transmission capacity, hydrogen storage requirements, and the aggregate cost expressed in billions of USD. In the context of a 50% reduction in solar PV expenditures, the overall system costs exhibit a substantial decline across all scenarios analysed. For instance, within the scenario encompassing 475 GW of solar, 0 GW of wind, and 28 GW of HeCC, the total cost experiences a reduction from 817 billion USD to 527 billion USD. The most economical outcome in this scenario characterized by diminished PV costs is observed with 78 GW of solar, 200 GW of wind, and 28 GW of HeCC, culminating in a total expenditure of 499 billion USD. This reduction in costs illustrates that a decrease in solar PV expenditures can enhance the economic viability of solar dominant configurations; however, the most cost-effective results continue to derive from a well-balanced integration of both wind and solar energy sources.

Table 16: Cost Analysis of Solar-Wind-HeCC Power Integration with 50% Reduced PV Costs
Figure 7 provides a visual representation comparing the overall power generation expenditures associated with standard solar photovoltaic (PV) costs versus those in reduced cost scenarios, thereby elucidating the economic advantages derived from diminished solar costs, particularly in the context of the integration of solar energy with wind and Hydrogen Energy with Carbon Capture (HeCC) power modalities.

Figure 7: Comparison of Total Power Generation Cost
These evaluations underscore the imperative of optimizing the energy portfolio comprising solar, wind, and HeCC sources to facilitate economically viable hydrogen production and subsequent exportation, especially considering the fluctuations in solar PV cost scenarios.
Conclusion
This paper examines the feasibility of using solar PV, wind, and helium combined cycle gas turbines (HeCCGT) to achieve carbon emission reduction and boost hydrogen exports in oil-dependent countries. Two distinct scenarios are analyzed: the first scenario integrates hydrogen combined cycle gas turbines (H2CCGT) as a complementary power source to solar and wind, while the latter scenario replaces hydrogen combined cycle gas turbines (H2CCGT) with helium combined cycle gas turbines (HeCCGT), thereby increasing the overall system efficiency. The main results confirm that during peak operational periods, solar irradiance can rise to 999 W/m2, resulting in significant solar power generation, while wind power provides a steady contribution, especially in the winter months, peaking at 284 GW. The analysis also indicates that hydrogen combined cycle gas turbines effectively stabilize power production, thereby eliminating the need for backup power systems in the second scenario. Hydrogen production remains robust throughout all seasons, with peak production reaching 646 TJ in winter, equivalent to 5,382 tonnes of hydrogen (2,100 PJ, equivalent to Libya’s annual oil production). Note 2100 PJ is equivalent to 17 500 000 tonnes, of H2 for oil export replacement From an economic perspective, the 50% cost reduction associated with solar PV systems significantly reduces the total system overhead, making solar-focused configurations more feasible, although the most economically beneficial approach remains a balanced integration of solar and wind energy sources. These f indings provide a strategic framework for optimizing the energy portfolios of oil-dependent countries, thereby facilitating their transition towards sustainable energy systems while simultaneously advancing global decarbonization initiatives.
It is of interest that Libya, normally thought of as a sunny country requires double the solar capacity than wind generation capacity. This is primarily due to the low utilization arising from long periods of darkness. It is also of interest to note that the area required for solar power is a third of what is needed for wind energy, notwithstanding the much larger solar generation capacity needed. This presents a very interesting dilemma for energy planners. In particular it raises the matter of how land areas could offer additional utilization opportunities. Finally, the methods, although approximate, do reveal a need for vast investments in decarbonization.
It is of interest that Libya, normally thought of as a sunny country requires double the solar capacity than wind generation capacity. This is primarily due to the low utilization arising from long periods of darkness. It is also of interest to note that the area required for solar power is a third of what is needed for wind energy, notwithstanding the much larger solar generation capacity needed. This presents a very interesting dilemma for energy planners. In particular it raises the matter of how land areas could offer additional utilization opportunities.
Finally, the methods, although approximate, do reveal a need for vast investments in decarbonization.
Author Contributions
Conceptualization, A.R.; M.G and P.P.; methodology, A.R..; M.G and P.P.; investigation, A.R..; M.G and P.P.; writing—original draft preparation, A.R.; M.G and P.P.; writing—review and editing, A.R..; M.G and P.P.; supervision, P.P. and A.R. All authors have read and agreed to the published version of the manuscript.
Funding
This research received no external funding.
Data Availability Statement
No new data were created or analysed in this study. Data sharing does not apply to this article.
Acknowledgments
We would like to express our gratitude for the invaluable support that went beyond the scope of author contributions and funding. Special thanks are extended to those who provided administrative and technical assistance. Your contributions have played a pivotal role in the success of this research. Also, I express my sincere gratitude to the Libyan embassy for generously supporting my PhD.
References
1. Ghazali, F., Shukor, S. F. A., & Karim, R. (2024). RENEWABLE ENERGY DEVELOPMENT TOWARDS SUSTAINABLE DEVELOPMENT GOALS: A REVIEW IN THAILAND AND THE PHILIPPINES’LAWS AND POLICIES. Journal of Nusantara Studies (JONUS), 9(2), 1-33.
2. Peng, X., Sun, L., Feng, K., Zhong, H., Liang, J., Zhang, C., ... & Hubacek, K. (2024). Extent of global decarbonization of the power sector through energy policies and governance capacity. Communications Earth & Environment, 5(1), 321.
3. Lau, H. C., & Tsai, S. C. (2023). Global Decarbonization: Current Status and What It Will Take to Achieve Net Zero by 2050. Energies, 16(23), 7800.
4. Guo, Y., Yang, Y., Bradshaw, M., Wang, C., & Blondeel, M. (2023). Globalization and decarbonization: Changing strategies of global oil and gas companies. Wiley Interdisciplinary Reviews: Climate Change, 14(6), e849.
5. Meadowcroft, J., & Rosenbloom, D. (2023). Governing the net-zero transition: Strategy, policy, and politics. Proceedings of the National Academy of Sciences, 120(47), e2207727120..
6. Vidadili, N., Suleymanov, E., Bulut, C., & Mahmudlu, C. (2017). Transition to renewable energy and sustainable energy development in Azerbaijan. Renewable and Sustainable Energy Reviews, 80, 1153-1161.
7. Ha, Y. H., & Byrne, J. (2019). The rise and fall of green growth: Korea's energy sector experiment and its lessons for sustainable energy policy. Wiley Interdisciplinary Reviews: Energy and Environment, 8(4), e335.
8. Kabeyi, M. J. B., & Olanrewaju, O. A. (2022). Sustainable energy transition for renewable and low carbon grid electricity generation and supply. Frontiers in Energy research, 9, 743114
9. Alagoz, E., & Alghawi, Y. (2023). The Energy Transition: Navigating the Shift Towards Renewables in the Oil and Gas Industry. J. Energy Nat. Resour, 12(2), 21-24.
10. Genc, T. S., & Kosempel, S. (2023). Energy transition and the economy: a review article. Energies, 16(7), 2965.
11. Hassan, Q., Viktor, P., Al-Musawi, T. J., Ali, B. M., Algburi, S., Alzoubi, H. M., ... & Jaszczur, M. (2024). The renewable energy role in the global energy Transformations. Renewable Energy Focus, 48, 100545,
12. Asif, m., sahin, g., & khalid, m. (2024). Handbook of energy and environment in the 21st century. Nkumba university.
13. Lagioia, G., Spinelli, M. P., & Amicarelli, V. (2023). Blue and green hydrogen energy to meet European Union decarbonisation objectives. An overview of perspectives and the current state of affairs. International Journal of Hydrogen Energy, 48(4), 1304-1322.
14. Blay-Roger, R., Bach, W., Bobadilla, L. F., Reina, T. R., Odriozola, J. A., Amils, R., & Blay, V. (2024). Natural hydrogen in the energy transition: Fundamentals, promise, and enigmas. Renewable and Sustainable Energy Reviews, 189,11388.
15. Hassan, Q., Algburi, S., Jaszczur, M., Al-Jiboory, A. K., Al Musawi, T. J., Ali, B. M., ... & Sameen, A. Z. (2024). Hydrogen role in energy transition: A comparative review. Process Safety and Environmental Protection..
16. Revinova, S., Lazanyuk, I., Gabrielyan, B., Shahinyan, T., & Hakobyan, Y. (2024). Hydrogen in Energy Transition: The Problem of Economic Efficiency, Environmental Safety, and Technological Readiness of Transportation and Storage. Resources, 13(7), 92.
17. Adelekan, O. A., Ilugbusi, B. S., Adisa, O., Obi, O. C., Awonuga, K. F., Asuzu, O. F., & Ndubuisi, N. L. (2024). Energy transition policies: a global review of shifts towards renewable sources. Engineering Science & Technology Journal, 5(2), 272-287.
18. Rawesat, A., & Pilidis, P. (2024). ‘Greening’an Oil Exporting Country: A Hydrogen and Helium Closed-cycle Gas Turbines Case Study. Clean Energy and Sustainability, 2(2), 10005.
19. Newell, r., raimi, d., villanueva, s., & prest, b. (2020). Global energy outlook 2020: energy transition or energy addition. Resources for the future.
20. Dantas, a., dantas, r., cipriano, g. P., de jesus, a., lesiuk, g., fonseca, c., ... & correia, j. A. (2024). Effect of seawater corrosion on the mechanical behaviour of s690 steel. Procedia structural integrity, 54, 593-600.
21. Engeland, K., Borga, M., Creutin, J. D., François, B., Ramos, M. H., & Vidal, J. P. (2017). Space-time variability of climate variables and intermittent renewable electricity production–A review. Renewable and Sustainable Energy Reviews, 79, 600 617.
22. Jaszczur, M., Dudek, M., & Kolenda, Z. (2019). Thermodynamic analysis of high temperature nuclear reactor coupled with advanced gas turbine combined cycle. Thermal Science, 23(Suppl. 4), 1187-1197.
23. E. Falcao, G. Ribeiro, and L. Guimarães, “Second Law Based Closed Brayton Cycle Regenerator Optimization,” Associacao Brasileira de Engenharia e Ciencias Mecanicas - ABCM, Mar. 2019.
24. Anderson, D., & Leach, M. (2004). Harvesting and redistributing renewable energy: on the role of gas and electricity grids to overcome intermittency through the generation and storage of hydrogen. Energy policy, 32(14), 1603-1614.
25. Sikiru, S., Oladosu, T. L., Amosa, T. I., Olutoki, J. O., Ansari, M. N. M., Abioye, K. J., ... & Soleimani, H. (2024). Hydrogen powered horizons: Transformative technologies in clean energy generation, distribution, and storage for sustainable innovation. International Journal of Hydrogen Energy, 56, 1152-1182.
26. Mattson, L. D. (2024). Not Zero by 2050: BP and Quid Pro Quo Sustainability. Environmental Communication, 1-16.
27. Papadis, E., & Tsatsaronis, G. (2020). Challenges in the decarbonization of the energy sector. Energy, 205, 118025.
28. Caetano, T., Winkler, H., & Depledge, J. (2020). Towards zero carbon and zero poverty: integrating national climate change mitigation and sustainable development goals. Climate Policy, 20(7), 773-778.
29. Kabeyi, M. J. B., & Olanrewaju, O. A. (2022). Sustainable energy transition for renewable and low carbon grid electricity generation and supply. Frontiers in Energy research, 9, 743114.
30. Benasla, M., Hess, D., Allaoui, T., Brahami, M., & Denaï, M. (2019). The transition towards a sustainable energy system in Europe: what role can North Africa's solar resources play?. Energy Strategy Reviews, 24, 1-13.
31. G. A. Asst Suhad Rasheed, “Title: The Energy Transition: Implications for Oil-Exporting Countries and Climate Change.”
32. Mutezo, G., & Mulopo, J. (2021). A review of Africa's transition from fossil fuels to renewable energy using circular economy principles. Renewable and Sustainable Energy Reviews, 137, 110609.
33. Outlook, e. A. E. (2021). African development bank-building today, a better africa tomorrow. Retrieved from afdb. Org.
34. Sgouridis, S., Abdullah, A., Griffiths, S., Saygin, D., Wagner, N., Gielen, D., ... & McQueen, D. (2016). RE-mapping the UAE’s energy transition: An economy-wide assessment of renewable energy options and their policy implications. Renewable and Sustainable Energy Reviews, 55, 1166-1180
35. Dadashi, z., mahmoudi, a., & rashidi, s. (2022). Capacity and strategies of energy production from renewable sources in arab countries until 2030: a review from renewable energy potentials to environmental issues. Environmental science and pollution research, 29(32), 47837-47866.
36. Amran, Y. A., Amran, Y. M., Alyousef, R., & Alabduljabbar, H. (2020). Renewable and sustainable energy production in Saudi Arabia according to Saudi Vision 2030; Current status and future prospects. Journal of Cleaner Production, 247, 119602.
37. Alnaqbi, S. A., & Alami, A. H. (2023). Sustainability and Renewable Energy in the UAE: A Case Study of Sharjah. Energies, 16(20), 7034.
38. International Energy Agency. (2021). Assessing the effects of economic recoveries on global energy demand and CO2 emissions in 2021. Global Energy Rev.
39. Alzoubi, A. (2021). Renewable Green hydrogen energy impact on sustainability performance. International Journal of Computations, Information and Manufacturing (IJCIM), 1(1).
40. Renewable energy agency, renewable energy statistics 2020 statistiques d’énergie renouvelable 2020 estadísticas de energía renovable 2020 about irena. 2020. [online].
41. Atalay, Y., Biermann, F., & Kalfagianni, A. (2016). Adoption of renewable energy technologies in oil-rich countries: Explaining policy variation in the Gulf Cooperation Council states. Renewable Energy, 85, 206-214.
42. International Renewable Energy Agency. (2021). Renewable Energy Statistics 2021 Statistiques D’énergie Renouvelable 2021 Estadísticas De Energía Renovable 2021 about Irena. Available: www.irena.org
43. “the paris agreement,” 2016. [online]. available: https:// treaties.un.org/pages/viewdetails.aspx?src=treaty&mtdsg_ no=xxvii-7
44. Rawesat, A., & Pilidis, P. (2024). ‘Greening’an Oil Exporting Country: A Hydrogen, Wind and Gas Turbine Case Study. Energies, 17(5), 1032.
45. Rawesat, m. Mohammed, s. Impey, and p. Pilidis, “ecol conserv sci greening an oil exporting country: libyan hydrogen, solar and gas turbine case study,” ecol conserv sci, vol. 4, no. 2, 2024, doi: 10.19080/ecoa.2023.04.555633.
46. Rawesat and P. Pilidis, “Type of the Paper (Article,” 2024, doi: 10.3390/xxxxx.
47. Rawesat, Y., & Salah, S. (2021). Energy Demands and Daily Consumption Patterns in Libya. Private Communication.
48. Country economy., “https://countryeconomy.com/energy and-/electricity-generation/libya (accessed 8 october 2022),” 2022.
49. OPEC, “monthly oil market report 2021 https://www.opec. org/opec_web/en/21.htm,” 2021.
50. Our World in Data. (2022). Libya: Energy Country Profile.
51. Rawesat, A., & Pilidis, P. (2024). ‘Greening’an Oil Exporting Country: A Hydrogen, Wind and Gas Turbine Case Study. Energies, 17(5), 1032.


