Research Article - (2021) Volume 2, Issue 1
The Comparison Between Gumbel and Exponentiated Gumbel Distributions and Their Applications in Hydrological Process
Received Date: Aug 26, 2021 / Accepted Date: Sep 06, 2021 / Published Date: Oct 15, 2021
Abstract
The Exponentiated Gumbel (EG) distribution has been proposed to capture some aspects of the data that the Gumbel distribution fails to specify. it has an increasing hazard rate. The Exponentiated Gumbel distribution has applications in hydrology, meteorology, climatology, insurance, finance and geology, among many others. In this paper Firstly, the mathematical and statistical characteristics of the gumbel and Exponentiated Gumbel distribution are presented, then the applications of this distributions are studied using the real data set. Its first moment about origin and moments about mean have been obtained and expressions for skewness, kurtosis have been given. Estimation of its parameter has been discussed using the method of maximum likelihood. In the end, two applications of the gumbel and exponentiated gumbel distribution have been discussed with two real lifetime data sets. The results also confirmed the suitability of the Exponentiated Gumbel distribution for real data collection.
Keywords
Gumbel distribution, Exponentiated gumbel (EG) distribution, Moments, hydrological data, Parameter estimation and goodness of fit.
Introduction
Gumbel presents a new model the (Gumbel model) as an extension of the exponential distribution. It is well known that this distribution presents a hazard function that is increasing and decreasing depending on the parameter values. Moreover, another feature of the distribution is that it can be used to fitting extreme data sets. The Gumbel distribution and extensions have been applied to different areas of scientific knowledge such as hydrology, meteorology, climatology, insurance, finance and geology, among many others [1-3]. Gumbel uses the model to fit extreme values of random data [4]. The book by Kotz and Nadarajah deals with the Gumbel distribution with a view of applying it to data sets raging from wind speed to flooding data [5]. The cdf of Gumbel distribution is:

Another exponentiated distribution is the EG distribution which was introduced by Nadarajah and Kotz [6].
The purpose of this paper is the comparison between gumbel and exponentiated gumbel distributions in hydrological models. we show that the exponentiated gumbel distributions in the same conditions works better than other distributions for modeling environmental data. The exponentiated gumbel distribution and its properties is introduced in Section 2. The moments and incomplete moments of the exponentiated gumbel distribution are given in Section 3. Section 4 deals with the Maximum likelihood (ML) estimation of the unknown parameters. We provide two real data applications in Section 5. The paper ends with some concluding remarks.
The Exponentiated Gumbel Distribution and Its Properties
A random variable X has the EG distribution with two parameters if its cumulative distribution function (cdf) is given by

The corresponding probability density function (pdf) of the EG function is as follows:
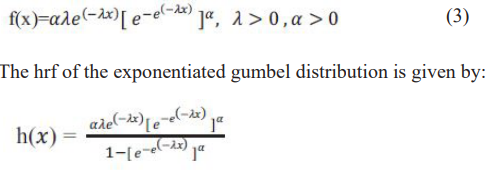
The pdfs of the EG distribution are plotted in Figure 1 for some selected values of parameters. It can be seen that the pdf of this distribution is decreasing depending on the parameter values. Figure 2 contains the plots of the hrfs of the EG distribution for different values of parameters. From Figure 2, we can observe that the hrf is increasing, depending on the parameter values.
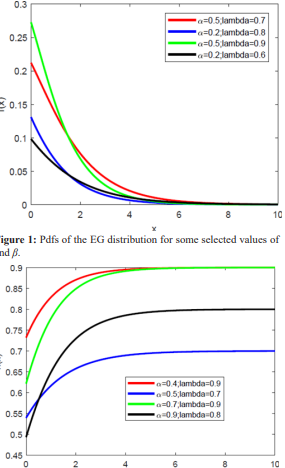
Figure 2: Hrfs of the E-G distribution for some selected values of and β.
The Moments and Incomplete Moments
Moments are necessary and important in any statistical analysis, especially in applications. It can be used to study the most important features and characteristics of a distribution. In this section, we present complete and incomplete moments of the EG distribution. But first, we present an expansion for f(x) in order to obtain expressions for the moments. Using the exponential expansion, we have
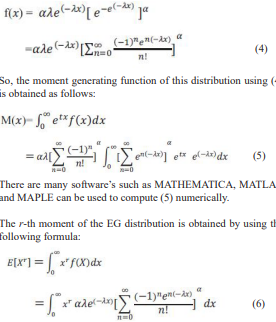
it can be calculated by MAPLE.
Based on the first four moments, the skewness and kurtosis of the exponentiated gumbel distribution can be obtained from the following equations respectively:

Maximum Likelihood Estimation
Let x1 ,.. , xn be a random sample of size n from the EG distribution. Then, the likelihood function is given by:

Consequently, the log-likelihood function is:

The maximum likelihood estimates of the parameters may be obtained by maximizing the log-likelihood function with respect to the parameters. To this end, we take the derivatives of the loglikelihood function with respect to the parameters and then equate the results with zero. Therefore, the maximum likelihood estimates of α,λ, denoted by , respectively, are obtained by solving the following nonlinear equations simultaneously:

The above equation does not seem to have explicit solutions, thus numerical methods may be applied to finding the roots.
In order to construct approximate confidence intervals and test hypotheses on the parameters, we obtain the observed Fisher information matrix, which is defined as:

Under the regularity conditions (see for example Lehmann and Casella, 1998, pp. 461-463), the asymptotic inference for the vector of parameters, i.e. Θ = (α,λ)T , based on normal approximation can be used. When the sample size n is large enough, then is asymptotically a two-variate normal random vector with mean (0,0)T and the variance-covariance matrix that equates to the inverse of the expected Fisher information matrix i.e. J(θ)-1. This asymmetric behavior holds if we replace J(θ)-1 with .
If unknown parameters appear in the variance-covariance matrix, then they can be replaced by their respective maximum likelihood estimates. Using the normal approximation, we can obtain approximate (asymptotic) confidence intervals for the parameters. Applications.
In this section, we present applications of EG distribution using real data. These applications demonstrate the flexibility of this distribution compared to the other models for the real data set. We compare the fit of the EG distribution with those of some other lifetime distributions which are Weibull Lomax, Exponential Lomax and Rayleigh Lomax distributions.
All the computations presented in this section were done using the MATLAB and R software
The first data set analyzed in this application is related to the snow accumulation in inches in the Raleigh-Durham airport, North Carolina, from 1948 to 2000. The data set involve 63 observations and are listed next:
1.0,2.5,1.2,1.2,4.1,9.0,3.0,1.0,1.4,2.0,3.0,1.7,1.2,1.2,1.1,1.5,5.0,1. 6,2.0,0.1,0.4,0.8,3.7,1.3,3.8,0.1,0.1,0.2,2.0,7.6,0.1,1.8,0.5,0.5,0.5, 1.1,1.4,1.0,1.0,0.7,5.7,0.4,0.3,1.8,0.4,1.0,1.2,2.6,1.0,5.0,1.7,2.4,0. 1,0.5,7.1,0.2,0.7,0.1,2.7,2.9,0.4,2.0,20.3.
The second data set analyzed corresponds to 264 observations of the maximum of monthly wind speed (mph) in Palm Beach, Florida (USA) for the months January, 1984 to December, 2005. Data is available for downloading at the site http://www.ncdc.noaa.gov. For the sake of completeness are presented in the following:
33,40,46,41,31,37,41,56,45,31,40,35,33,43,36,36,48,45,51,44,38, 36,40,32,51,37,43,33,35,44,41,41,33,45,38,43,62,45,51,39,35,58, 48,35,43,49,43,39,39,40,39,45,48,43,45,36,40,36,47,35,40,39,44, 37,36,38,37,41,38,36,36,48,37,40,38,37,37,38,49,66,39,45,37,35, 39,52,66,51,39,64,59,36,36,36,41,41,39,45,40,37,33,66,38,59,38, 41,45,35,43,39,74,63,37,45,52,43,44,52,36,43,46,40,43,29,39,53, 32,41,52,31,46,48,49,41,32,37,29,43,40,47,45,38,28,30,40,36,37, 38,37,33,30,34,38,45,40,31,39,31,31,38,32,34,45,39,31,29,39,36, 34,55,38,37,36,34,44,32,54,30,39,30,41,33,36,39,33,33,30,40,44, 61,34,26,38,26,34,36,28,36,43,35,43,37,40,35,36,28,41,30,31,48, 43,43,49,36,38,30,33,35,36,45,29,43,33,39,38,29,38,41,31,35,40, 33,51,33,40,45,32,29,35,37,35,30,32,39,32,39,38,39,83,30,33,39, 33,36,39,44,31,43,44,43,41,101,37,33.
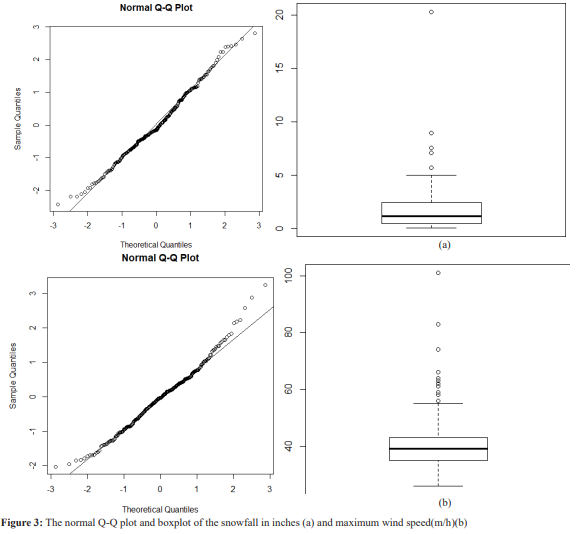
Figure 3 presents a normal Q-Q plot and a boxplot of the snowfall in inches (a) and maximum wind speed(m/h)(b) respectively. For first data Most of the observations are dispersed around 2.0 inches of accumulation with one extreme value at 20.3 inches. for second data It reveals that most of the observations are around the 40 (m/h) excluding an atypical value of 101 (m/h).
We use the Anderson-Darling (ADR) test statistics, the Akaike information criterion (AIC) and the Bayesian criterion (BIC) in order to compare the fits. The computed MLEs, ADR and the values of AIC and BIC for both data sets are given in Table 1. These criteria are widely utilized to check how closely a specified cdf fits the empirical distribution of a given data set. It is well-known that the smaller values of AIC, BIC and ADR test statistic mean a better fit to the data. Here, it is observed from Table 1 that the E-G model outperforms all the other considered models in the sense of the considered criteria. We use the Anderson-Darling (ADR) test statistics, the Akaike information criterion (AIC) and the Bayesian criterion (BIC) in order to compare the fits. The computed MLEs, ADR and the values of AIC and BIC for both data sets are given in Table 1. These criteria are widely utilized to check how closely a specified cdf fits the empirical distribution of a given data set. It is well-known that the smaller values of AIC, BIC and ADR test statistic mean a better fit to the data. Here, it is observed from Table 1 that the E-G model outperforms all the other considered models in the sense of the considered criteria.
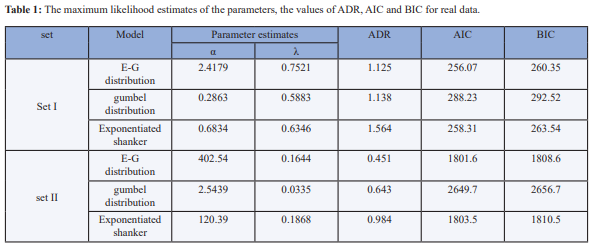
It can be seen from the Table 1, the exponentiated gumbel distribution has the smallest values of the ADR, AIC and BIC values. Therefore, it can be concluded that the best fits belong to the exponentiated gumbel distribution, i.e., the E-G distribution among the other considered distribution in this section. For the sake of visual comparison, the estimated pdfs of the considered distributions as well as the empirical histograms of the data sets are given in Figure 4. It is obvious from the figures, that the exponentiated gumbel distribution provides the best fit for real data set in comparison with the other considered distributions.

Concluding Remarks and Future Works
In this paper, the gumbel and the exponentiated gumbel was introduced and some of its math properties were discussed. This distribution has two parameters and its cdf and hrf have simple forms. The hrf of the exponentiated gumbel distribution can be increasing shaped depending on the values of the parameters. Generally, we can say that the Exponentiated Gumbel distribution provides a more flexible model for fitting a wide range of real data sets in comparison with some other distributions and thus it can be an appropriate alternative distribution for some other existing models, in modelling real data that may appear in many areas like engineering, survival analysis, hydrology, economics and so on.
Several properties of this distribution, like sequential statistics, sequential statistical moments, the asymptotic distribution of extreme values, stochastic orderings and distribution of the ratio of two random variables have not been presented in this paper. In addition, there exist some inferential topics related to the exponentiated gumbel distribution like Bayesian estimation of the parameters, estimation based on censored samples, estimation by means of other methods like the diagonally weighted least-squares method, prediction of the future observations from this distribution and so on. We hope to work on some of the mentioned topics and report our findings in future.
References
1. Arnold BC, Castillo E, Sarabia JM (1998) Some Alternative Bivariate Gumbel Models. Environmetrics 9: 599-616.
2. EL Lehmann, G Casella (1998) Theory of Point Estimation, Second Edition, Springer-Verlag, New York.
3. Gumbel EJ (1954) Statistical theory of extreme values and some practical applications. Applied mathematics series 33. U.S. Department of Commerce, National Bureau of Standards 1954: 60.
4. Gumbel EJ (1958) Statistics of Extremes, Columbia University Press, New York 1958: 378.
5. Kotz S, Nadarajah S (2000) Extreme Value Distributions: Theory and Applications, Imperial College Press, London 2000: 196.
6. Nadarajah S, Kotz S (2006) The Exponentiated Type Distributions. Acta Applicandae Mathematica 92: 97-111.
Copyright: © 2025 This is an open-access article distributed under the terms of the Creative Commons Attribution License, which permits unrestricted use, distribution, and reproduction in any medium, provided the original author and source are credited.


