Research Article - (2021) Volume 2, Issue 1
Switching Towards a Proactive Grid Based Data Management Approach
Received Date: Aug 23, 2021 / Accepted Date: Sep 15, 2021 / Published Date: Oct 11, 2021
Abstract
Over time, an exorbitant data quantity is generating which indeed requires a shrewd technique for handling such a big database to smoothen the data storage and disseminating process. Storing and exploiting such big data quantities require enough capable systems with a proactive mechanism to meet the technological challenges too. The available traditional Distributed File System (DFS) becomes inevitable while handling the dynamic variations and requires undefined settling time. Therefore, to address such huge data handling challenges, a proactive grid base data management approach is proposed which arranges the huge data into various tiny chunks called grids and makes the placement according to the currently available slots. The data durability and computation speed have been aligned by designing data disseminating and data eligibility replacement algorithms. This approach scrumptiously enhances the durability of data accessing and writing speed. The performance has been tested through numerous grid datasets and therefore, chunks have been analysed through various iterations by fixing the initial chunks statistics, then making a predefined chunk suggestion and then relocating the chunks after the substantial iterations and found that chunks are in an optimal node from the first iteration of replacement which is more than 21% of working clusters as compared to the traditional approach.
Keywords
Data Mining, Exorbitant, Nodes, Disseminating Process, Data Chunks, Slots, Grid, Data Storage
Introduction
It is indeed a big hassle for information system that continue to create and handle the amount of data, and the production of digital data has never been more abundant. Although the projected amount of data generated in 2010 was 2 Zettabytes, in 2020 it is estimated that it will be 47 ZB and in2025 it will rise to 175 ZB and in 2035 it is 2142 ZB [1]. The use of data mines has also become a sophisticated and difficult process. Big data systems are therefore placed in the position of an efficient, effective and scalable way to use this amount of data [2]. Big data systems thus have the objective of storing and analysing very large amounts of data while guaranteeing a sufficient level of data security and accessibility. Most big data systems like the Apache Hadoop, in this context, entrust the administration of data storage to distributed systems of files (DFS) [3].
The system Hadoop Big Data is built on HDFS, (the standard DFS of HADOOP). Hadoop can accomplish complicated calculations on extended clusters together with other data processing layers [4]. HADOOP aims primarily to spread complicated processes across several computers, closer to the data involved and therefore enhance global performance. This distributed architecture based on the DFS also depends on the capacity and performance of similar platforms like Facebook and Google. Thus, multiple storage nodes, typically clustered in racks and interconnects over local or broad networks, are managed by HDFS for the storing, storage and computation of data alone. HDFS machines are usually lowcost machine, easily changed and have no special qualities [5]. The breakdown security is given by the striping-based data placement method that creates multiple copies (replicas) of the same data. Set replica of the data blocks called chunks, on many machines dispersed over several racks (as much as possible) [6].
The positioning of replies does not, however, take into account the type or progress of the demand for particular data. Even while HDFS permits computers with varied features to be integrated on the same cluster, machines’ performance is not regarded too much [7]. These weaknesses in HDFS’ data placement strategy have led us to propose an upgrade in this approach as a new algorithm which reflects the history of readings and suggests that data should be redistributed around the cluster. The research proposed begins with a comprehensive understanding of HADOOP and HDFS working processes to develop an algorithm which is applicable and applicable [8]. To create an algorithm that is relevant and implementable, the performance is evaluated on a tiny cluster to control data transfers and therefore demonstrate the efficiency of the method even on a small scaled of HDFS [9].
The rest of the manuscript is arranged as; The background study comprises of HADOOP architecture is covered in section 2, while the proposed architecture is given in section 3. The improving mechanism in proposed architecture is explained in section 4. The performance has been tested in section 5 and section 6 is comprises on big data challenges. Section 7, is dedicated for result and discussion matter while in section 8, the concluding remarks and future directions have been discussed.
About Hadoop Architecture
The data storage layer is represented by HDFS (Hadoop Distributed File System), which handles data distribution throughout the cluster and constantly maintains data integrity and permanence. The layer controls storage servers too (DataNode). Based on the MapReduce architecture, the data processing layer controls the parallelization of calculations throughout the cluster [8]. As a result, Hadoop has two types of Masters: the NameNode, which is in charge of the HDFS component, and the JobTracker, which is in charge of MapReduce implementation [10]. The NameNode is replicated for high availability purposes and the remainder of the cluster comprises nodes running the storage process DataNode (communicates with HDFS exclusively NameNode) and TaskTraker for processing of data (communicates exclusively with YARN JobTracker or resource manager) [11]. YARN is used to write, read or offer instructions on how these data should be handled and report to the ResourceManager for status of the nodes, using the ResourceManager that handles multiple NodeManager accountable for the client’s distribution. The customer will contact masters and slaves to write, read or teach you how to handle these data. Figure 1 shows the organisation of Hadoop a fundamental depiction.
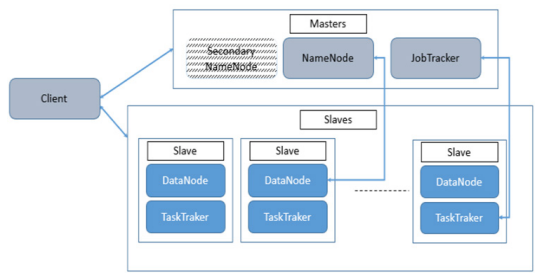
Figure 1: Hadoop Architecture
The client wished to access the information would then read the content of the block from the closest DataNode, during the reading of the data block. When the client is writing, NameNode is asked to specify a three-dataNodes suite that can hold block replicas [12]. The data is then entered as a pipeline, user as node1, then node 1 as node 2 and node2 as node 3 in the DataNodes. Only one active NameNode per cluster is in the present architecture. Because each DataNode may execute several application activities at the same time, the cluster can contain thousands of DataNodes and tens of thousands of HDFS clients. Data processing is done by the JobTracker and customer created his MapReduce job and forwarded to the JobTracker, which separates it into several Map/ Reduce tasks and assigns everybody to a DataNode task tracker storing the data involved [13]. The findings may be obtained directly using HDFS readings.
About Proposed Architecture
In order to avoid the hardware failure issues mostly happened in Hadoop, a proactive data replication technique is being incorporated that aims to ensure the sustainability of the data in case of hardware or network technical problems [14]. To eliminate the hardware failure concerns that are common in Hadoop,

Figure 2: The proposed proactive data management architecture
A proactive data replication approach is being used, which seeks to assure the data’s sustainability in the event of hardware or network technical failures [15]. The suggested proactive architecture, depicted in Figure 2, divides files into numerous blocks of identical size (until the last one), known as chunks. This operation, known as Data Stripping, allows you to parallelize data access by storing these blocks on separate DataNodes, resulting in faster response times [16]. Every Block (typically three exemplars although it’s adjustable) is replicated by the proposed system and placed in a DataNode, which is decided by a given strategy.
Moreover, the replica number, also known as replication factor, is maintained by the NameNode and may be modified individually for any file at any moment [17]. It periodically gets data from each DataNode in order to maintain NameNode up-to-date.
there are received two sorts of information:
1. HeartBeat, which enables the NameNode to guarantee that the DataNode is still operating [18].
2. The DataNode BlockReport offers a list of valid data block(s) in NameNode.
The NameNode gives the user a list of DataNodes that host the data when creating a file (the list contains N DataNode where N is the replication factor). The user begins transferring the data in chunks to the first DataNode in the list, which writes it locally and begins transmitting it to the second DataNode in the list, and so on until the Nth DataNode is reached. HDFS uses a strategy that considers both the risk of failure and the speed of access when determining which DataNode will hold the Blocks during a write operation. The suggested system is frequently configured as a cluster of many racks containing numerous DataNodes. Interchanges between machines of different racks must inevitably take place through switches, which typically speed up the interchange between machines of the same rack than between machines of various racks [19].
Therefore, it will make sense, while conserving time and the bandwidth, to choose DataNode from the same slot, to insert all of the copies of one block. In this approach, however, a failure impacting a whole rack increases the vulnerability of the system. In the usual situation when the replication factor is 3, two Replicas are placed on the same rack of two DataNodes whilst the third is placed on a separate rack DataNode according to the storage space available. In the suggested method, Figure 3, is a graphical representation. If the replication factor is larger than three, these constraints are reinforced by the restriction of placing no more than two copies on the same Rack, or Data Node. Because one-third of the data is transferred in a single rack, this technique allows for greater data availability in the event of a network, rack, or switch failure [20]. It also optimises writing times. However, because the data is only available on two racks rather than three, this method may limit total parallel playback bandwidth [21].
This method also has a major flaw: it chooses the DataNode where replicas will be put at the time the chunk is created, without taking into account the development of traffic or demand on the replicas, or the capacity of the nodes chosen to hold the data. The first duplicate is generated on a DataNode near to the “writer” when the chunks are formed, however our simulations have shown that the need for copies might grow to other places. Furthermore, because Hadoop clusters are created us.ing low-cost hardware.
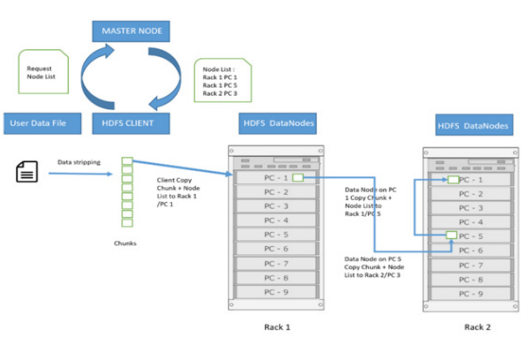
Figure 3: The proposed chunk substitution technique that might fail or become outdated, the cluster’s structure and composition can change quickly and dramatically.
This proposes sending the most often requested data (as determined by a cluster operation analysis) to the computers that are most eager to handle it as fast as feasible.
Improved Placement of Chunks
It is recommended that two metadata be added to the chunk metadata handled by HDFS in order to modify the position of a chunk in the grid. These metadata will be computed by the DataNode and sent to the MasterNode in the block report. Every time a chunk is consulted, they will be updated.
Equation 1 could be used to compute and explain these two metadata.
1. C: Chunk consultation rate which is the number of times throughout the customizable period chunks have been downloaded (such as one month)
2. Tc: The mean read time of the chunk during the same period.
where C represents the number of consultations and t_i is the reading time.
The suggested daemon that runs on the DataNode after each reading operation calculates the average read time. As an example Table 1, the NameNode has a condensed and sorted table of all chunks:

where C represents the number of consultations and t_i is the reading time.
The suggested daemon that runs on the DataNode after each reading operation calculates the average read time. As an example Table 1, the NameNode has a condensed and sorted table of all chunks:
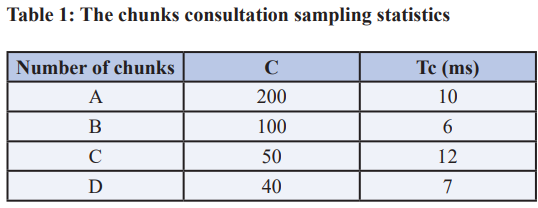
The chunks should have a completely ordered table at the start with a maximum C matching to a minimum Tc. However, the examination of data collected from a cluster of simulations reveals that demanded chunks have comparatively high reaction times. The objective of the suggested technique is to transfer the most demanded pieces to the nodes, which provide the optimum reading times (Pn). Metadata can determine the average performance of each using equation 2

where Pn denotes the average performance of node n. The amount of chunks in node n is emphasised by k and Ci displays how many chunks I insert into node n and Tci is a mean read time for Chunk i. Moving a piece to a better read times location doesn’t necessarily mean improving response times in that piece, as the average response time is depending also upon the type of request (read requests’ position, data processing...), but the evaluation algorithm from Tc continues to collect response times for moved pieces in its new location and allows the ne to be reviewed. After one-tomany repetitions of chunks moving, the improvement in mean consultation time will ultimately be apparent or at least stabilise in its minimal value, indicating that the chunks are in the optimal position in terms of reaction time. In order to not overwhelm the network more than required, the number of pieces must be restricted. Data moves should be done at a time when there is little or no access to data so that this process does not occupy the bandwidth.
The Data Disseminating Mechanism
The chunks consultation statistics are scanned by an optimization function from the highest number of queries that corresponds to the most requested chunks. In terms of reaction time, this part should be placed in the best node. In the best situation, the highest C chunks must be transferred to the lowest Pn node. As illustrated in figure 4, the associated suggested method will attempt to obtain an available node with the best Pn, and the related data dissemination algorithm 1, is also provided.
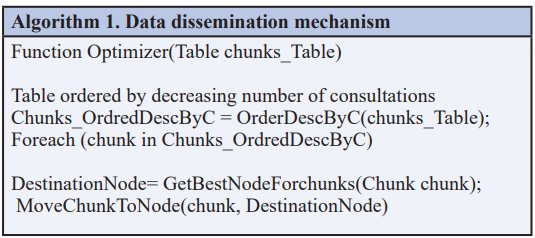
Getting Best Node for chunks
The GetBestNodeForchunks function continues to disseminate data, as described in Figure 5, enabling the retrieval of the node that provides the best average consultation time (Pn), indicating that it is an ideal place for a particular chunk. To do this, the pn is computed for each node in the table, and each node will verify its eligibility to receive the sent chunk by use of the chunks’ time of consultation, arranged by the wards according to the pn. Eligibility is likewise based on four criteria:
1. The node is different from the one where the chunk is already placed.
2. The availability of space on the node.
3. The Node does not already contain a chunk replica.
4. The Node is not in the same rack as two other replicas.
There may be no more than two copies in a same rack as specified in the Algorithm 2 which meet the requirements for the suggested method.
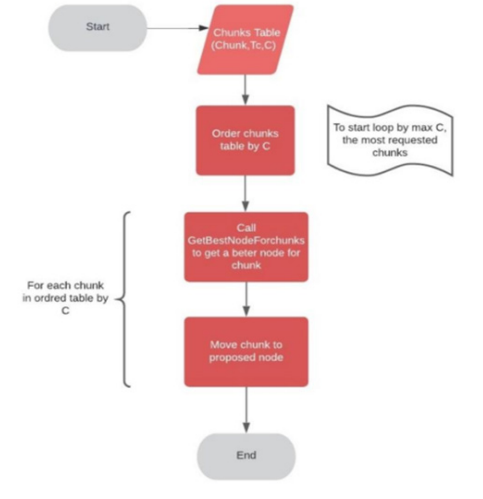
Figure 4: The proposed chunk substitution technique
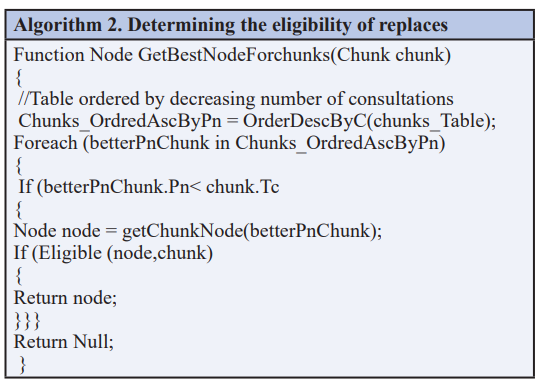
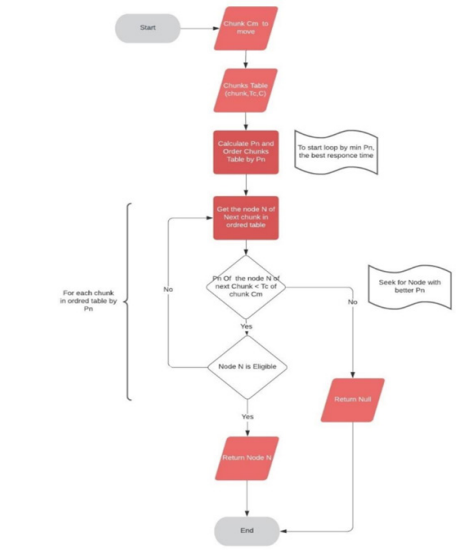
Figure 5: Determining the shrewd node
Computing the cluster performance
An indication was created in order to evaluate the overall performance of a cluster over a certain period that includes the response times while reading the fragments, but also the frequency [22], in which chunks are consulted. An average reading time for the pieces was determined, which is weighted by the number of consultations each chunk.

P and Ci have determined the performance of the cluster according to the number of consultations of each chunk such as i. Tci indicates the average reading time of the chunk i and n indicates total number of chunks in the cluster. The computation of this indicator will allow us to evaluate the influence on the cluster’s overall performance of the application of our method.
Testing Approach
In order to get the performance measurements, the meticulous dataset testing procedure is carried out on a test grid consisting of 12 nodes. The algorithm testing environment consists of three racks, each with four knots of identical storage capacity equivalent to three times the size of one chunk (3x64MO). The selection of this dimension enables us to limit the storage capacity to up to three chunks, thereby saturating the nodes fast and testing the ability of the algorithm to take this into account. The nodes have varied node performance characteristics, each of which comprises of the nodes in Table 2.
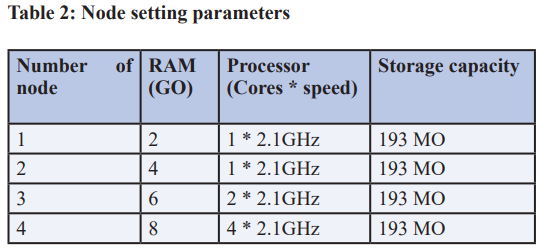
The test procedure was performed with 12 unit-size 64MB files. On Hadoop, the size block is 64MO and the replication factor is 3. This proposal involves the performance, on each of the 12 files spread on the grid, of a configurable number of tasks (map tasks) [23], in 12 Grid Nodes. Every task only calls one file, the consultation rate C is equal to the number of jobs performed. The stages were repeated across several iterations and the total performance P of the cluster was measured after each iteration.
Big Data Challenges
Big data, especially in the business context, refers to massive, complicated, poorly organised, and/or quickly changing data collections. The concept of big data, on the other hand, has a wide range of interpretations. The phrase “big data” refers to a wide range of topics, including technologies, analytical methodologies, modelling and design processes, commercial ideas, and legal framework. There is no consistent, complete, or correct definition of big data, as seen by this broad collection of extremely varied features and facts. Big data has reached a new stage in its already turbulent history; it is now a matter of public discussion on global requirements “one often laments that the public people does not have the time or resources to comprehend the data science underlying social scientific notions, this is a rare circumstance in which most now have both”, this is no longer a matter for professionals exclusively [24]. According to “Today, data science has evolved into an interdisciplinary activity that combines scientific theory and techniques with algorithms and systems”, it has become a multifunctional and multi-objective realm of knowledge [25].
Big data is defined as a vast volume of complicated structured, semi-structured, and unstructured data that exceeds the processing capacity of traditional databases. Decision making, forecasting, business analysis, product development, customer experience, and loyalty, to mention a few, all rely on big data processing and analysis [26]. As a result, the definition of “what is big data?” must be interpreted in relation to specific circumstances. When trying to define the phrase big data, the four V’s are frequently used in the literature [27]. However, because the four Vs are used in a technical context, they are only partially appropriate for defining big data. They outline the usual big data issues that traditional software solutions can no longer handle effectively. Volume, variety, velocity, and veracity are referred to as the four V’s. The following four words are defined in further depth.
• Volume (the amount of data can no longer be handled by conventional means): A lot of people think of volume as a huge amount of data that has to be handled. Because analysing huge volumes of data takes a long time and is expensive, technological big data solutions are frequently employed when data is generated or processed.
• Variety (the variety of data sources and data formats require a different data analysis): In the context of big data, the term variety describes the difficulty of processing data with unpredictable semantics and structure. As a result, it’s a matter of large volumes of data that aren’t well-structured. The processing of data in various forms (e.g., TXT, CSV, XML, etc.) as well as the variability of data quality are also significant issues.
• Velocity (the timely processing of data must be ensured): The data rate has steadily grown since the dawn of the information era and the accompanying representation of information as digital data. It is a measure of how much digital data can be processed or delivered in a unit of time The constant advancement of technology, and therefore the growth in data flow, offers a significant problem for data analysis.
Veracity (the data quality determines the success of big data): On the basis of predefined models and schemes, very good data quality is typically anticipated in traditional business intelligence (BI) systems. Due to the enormous volume of unstructured and semi-structured data, this high data quality is typically not accessible in reality. As a result, studies must account for a certain amount of uncertainty and unreliability. It is possible to discover this lack of reliability of data using good big data analysis solutions This is an important consideration, particularly in automated decision-making.
Big data, despite its advantages, is not without its drawbacks and obstacles. Businesses must invest in modern IT systems. There are also no standards and just a few ready-to-use solutions. Additionally, users must examine their data structure and associated procedures in addition to the technological concerns. Companies are additionally challenged by the enormous volume of information, as well as the diversity and short timeliness of the information. To avoid becoming engulfed in the data jungle, innovative big data methods are critical [28]. Transparency in the database, data sources, and diversity of data is critical for efficiently managing, validating, and analysing data. Nobody can succeed if they do not know what knowledge is accessible and in what form.
Results and Discussion
The gathered result is given in Table 3 after initial iterations have been executed.
Table 3: Initial chunks statistics table
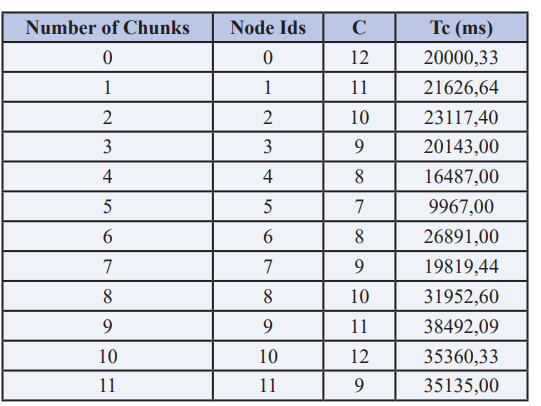
The C indicates the entire work performed and equates the consultation rates according to these data, as each job only calls a single file. Also, because to the selected file size and chunk settings, only one chunk corresponds to the file. The Tc is the average working time (MJT) for every file [29]. The total grid performance was therefore calculated as P1 = 25500 ms. The Tc computed by the original proposed placement method reflects the default condition at this stage. Table 5: Table of suggestions for relocation of Chunk. The suggested approach creates the improved sites as provided in Table 4 once the relocation is executed. The algorithm suggests moving 8 files to a new place. There were four files not moved since there should be no improvement in runtime at any of the locations provided.
Table 4: Chunk’s relocation suggestions
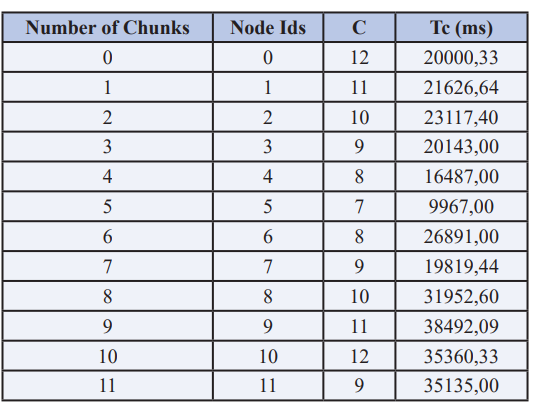
After the chunks have been transferred to the proposed nodes and jobset, the response time collection delivers results in Table 5, in which Tc has been recalculated. The whole new grid performance is P2 = 2013 ms and this value is 21 percent higher than P1. Figure 6 evaluates the total reaction time for the third iteration. P stabilises and changes the position of the chunks in accordance with the recommendations of the algorithm rarely impacts the grid’s overall performance. It has been inferred from this evaluation that the chunks are at an optimum node from the first iteration of chunks’ substitution. The cluster’s total performance increase is over 21%. After a single chunk replacement, this improvement was obtained.
Table 5: Chunks Statistics table after first relocation
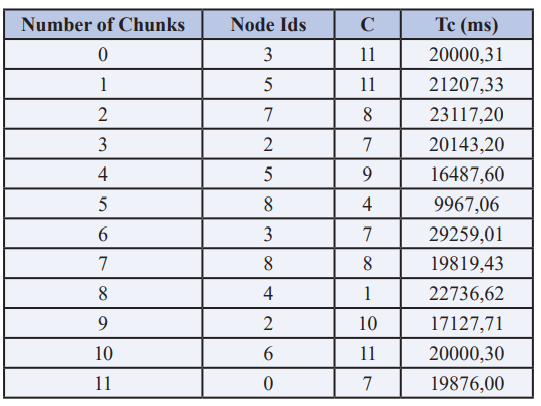

Figure 6: The performance comparison between proposed and traditional approach
Conclusion
The data storage and its accessibility become big hassle during large operations from multiple locations. The traditional datamining approaches sometime becomes confined and therefore system failure occurs. The proposed mechanism striping and replication becomes imperative in this situation therefore, a proactive grid based data management approach suggested that a detailed analysis of traditional approaches was performed to suggest an improvement to the replication location strategy and that, while observing the basic rules of the traditional initial chunk investment strategy, a substantial gain of over 21 per cent on the overall performance of the cluster could be achieved by the data set testing. For future development, a module is intended to integrate, based on the artificial Intelligence model, which determines the optimal data placement for a particular piece in the first writing, able to forecast the node response time. This reduces data motion of the clusters and prevents the use of undesirable bandwidth.
References
1. D SIMEONIDOU (2016) “OPTICAL SYSTEM ARCHITECTURES AND CONTROL FOR DATA CENTER NETWORKS,” IN 2016 21ST OPTOELECTRONICS AND COMMUNICATIONS CONFERENCE (OECC) HELD JOINTLY WITH 2016 INTERNATIONAL CONFERENCE ON PHOTONICS IN SWITCHING (PS), JUL. 2016: 1-1.
2. U SIVARAJAH, M M KAMAL, Z IRANI, V WEERAKKODY (2017) “CRITICAL ANALYSIS OF BIG DATA CHALLENGES AND ANALYTICAL METHODS,” J. BUS. RES 70: 263-286.
3. “DATA MINING - AN OVERVIEW | SCIENCEDIRECT TOPICS.” HTTPS://WWW.SCIENCEDIRECT.COM/TOPICS/ EARTH-AND-PLANETARY-SCIENCES/DATA-MINING (ACCESSED AUG. 07, 2021).
4. G SCHUH, J P PROTE, P HÜNNEKES (2020) DATA MINING METHODS FOR MACRO LEVEL PROCESS PLANNING,” PROCEDIA CIRP 88: 48-53.
5. W PARK (2020) “A STUDY ON ANALYTICAL VISUALIZATION OF DEEP WEB,” IN 2020 22ND INTERNATIONAL CONFERENCE ON ADVANCED COMMUNICATION TECHNOLOGY (ICACT) 2020: 81-83.
6. X DU, Q LE, M SCANLON (2020) “AUTOMATED ARTEFACT RELEVANCY DETERMINATION FROM ARTEFACT METADATA AND ASSOCIATED TIMELINE EVENTS,” IN 2020 INTERNATIONAL CONFERENCE ON CYBER SECURITY AND PROTECTION OF DIGITAL SERVICES (CYBER SECURITY) 2020: 1-8.
7. S. ASHRAF, D MUHAMMAD, Z ASLAM (2020) “ANALYZING CHALLENGING ASPECTS OF IPV6 OVER IPV4,” J. ILM. TEK. ELEKTRO KOMPUT. DAN INFORM 6: 54.
8. JY LEE, MH KIM, SA RAZA SHAH, SU AHN, H YOON, ET AL. (2021) “PERFORMANCE EVALUATIONS OF DISTRIBUTED FILE SYSTEMS FOR SCIENTIFIC BIG DATA IN FUSE ENVIRONMENT,” ELECTRONICS 10: 1471.
9. JP A YAACOUB, H N NOURA, O SALMAN, A CHEHAB (2021) “ROBOTICS CYBER SECURITY: VULNERABILITIES, ATTACKS, COUNTERMEASURES, AND RECOMMENDATIONS,” INT. J. INF. SECUR.
10. O AZEROUAL, R FABRE (2021) “PROCESSING BIG DATA WITH APACHE HADOOP IN THE CURRENT CHALLENGING ERA OF COVID-19,” BIG DATA COGN. COMPUT 5: 12.
11. K KULLMAN, N B ASHER (2019) “OPERATOR IMPRESSIONS OF 3D VISUALIZATIONS FOR CYBERSECURITY ANALYSTS,” 2019.
12. A IZADDOOST, M SIEWIERSKI (175) “ENERGY EFFICIENT DATA TRANSMISSION IN IOT PLATFORMS,” PROCEDIA COMPUT. SCI 175: 387-394,
13. L HUANG, J LIU, W MENG (2018) “A REVIEW OF VARIOUS OPTIMIZATION SCHEMES OF SMALL FILES STORAGE ON HADOOP,” IN 2018 37TH CHINESE CONTROL CONFERENCE (CCC) 2018: 4500-4506.
14. I. LEE (2017) “BIG DATA: DIMENSIONS, EVOLUTION, IMPACTS, AND CHALLENGES,” BUS. HORIZ 60: 293-303.
15. J R GOODALL (2009) “VISUALIZATION IS BETTER! A COMPARATIVE EVALUATION,” IN 2009 6TH INTERNATIONAL WORKSHOP ON VISUALIZATION FOR CYBER SECURITY 2009: 57-68.
16. J UHLMANN (142) “ON THE MONOTONIC LAGRANGIAN GRID AS ANTECEDENT TO THE NEIGHBORHOOD GRID,” J. PARALLEL DISTRIB. COMPUT 142: 13-15.
17. S ASHRAF, S SALEEM, T AHMED, Z ASLAM, D MUHAMMAD (2020) “CONVERSION OF ADVERSE DATA CORPUS TO SHREWD OUTPUT USING SAMPLING METRICS,” VIS. COMPUT. IND. BIOMED. ART 3:
18. R K JHA (2020) “OPTIMAL MACHINE LEARNING CLASSIFIERS FOR PREDICTION OF HEART DISEASE,” INT. J. CONTROL AUTOM 13: 7. 19. “DATA SCIENCE JOURNAL.” HTTP://DATASCIENCE. CODATA.ORG/ (ACCESSED AUG. 22, 2021).
20. H LI, C HUANG, G CHEN, X LIAO, T HUANG (2017) “DISTRIBUTED CONSENSUS OPTIMIZATION IN MULTIAGENT NETWORKS WITH TIME-VARYING DIRECTED TOPOLOGIES AND QUANTIZED COMMUNICATION,” IEEE TRANS. CYBERN 47: 2044- 2057.
21. “BANDWIDTH UTILIZATION - AN OVERVIEW | SCIENCEDIRECT TOPICS.” HTTPS://WWW. SCIENCEDIRECT.COM/TOPICS/ENGINEERING/ BANDWIDTH-UTILIZATION.
22. D NEZNIK, L DOBOS, J PAPAJ (2020) “SMART RADIO RESOURCE MANAGEMENT FOR CONTENT DELIVERY SERVICES IN 5G AND BEYOND NETWORKS,” MOB. INF. SYST 2020: 1-14.
23. K KALIA, N GUPTA (2021) “ANALYSIS OF HADOOP MAPREDUCE SCHEDULING IN HETEROGENEOUS ENVIRONMENT,” AIN SHAMS ENG. J 12: 1101-1110.
24. M Z KASTOUNI, A AIT LAHCEN (2020) “BIG DATA ANALYTICS IN TELECOMMUNICATIONS: GOVERNANCE, ARCHITECTURE AND USE CASES,” J. KING SAUD UNIV. - COMPUT. INF. SCI., NOV. 2020.
25. “BIG DATA RESEARCH - JOURNAL - ELSEVIER.” HTTPS://WWW.JOURNALS.ELSEVIER.COM/JOURNALS. ELSEVIER.COM/BIG-DATA-RESEARCH (ACCESSED AUG. 22, 2021).
26. “BIG DATA & SOCIETY,” SAGE JOURNALS. HTTPS:// JOURNALS.SAGEPUB.COM/HOME/BDS (ACCESSED AUG. 22, 2021).
27. JOURNAL OF BIG DATA. JOURNAL OF BIG DATA. HTTPS://JOURNALOFBIGDATA.SPRINGEROPEN.COM/.
28. “BIG DATA | MARY ANN LIEBERT, INC., PUBLISHERS.” HTTPS://HOME.LIEBERTPUB.COM/PUBLICATIONS/BIGDATA/611/OVERVIEW.
29. WD. LEES (2020) “TOOLS FOR ADAPTIVE IMMUNE RECEPTOR REPERTOIRE SEQUENCING,” CURR. OPIN. SYST. BIOL 24: 86-92,
Copyright: © 2025 This is an open-access article distributed under the terms of the Creative Commons Attribution License, which permits unrestricted use, distribution, and reproduction in any medium, provided the original author and source are credited.


