


Research Article - (2025) Volume 3, Issue 4
Optimizing Real Estate Portfolio Using Genetic Algorithm and Machine Learning Approaches
Received Date: Mar 03, 2025 / Accepted Date: Mar 31, 2025 / Published Date: Apr 04, 2025

Copyright: ©2025 LIU LiLi, et al. This article is licensed under the CC BY-NC-ND 4.0 License, permitting non-commercial use and sharing without modifications. Credit to the original authors and source is required.
Citation: WM Leong, L LIU, (2025). Optimizing Real Estate Portfolio Using Genetic Algorithm and Machine Learning Approaches. Eng OA, 3(4), 01-10.
Abstract
This study presents an integrated approach to Real Estate Investment Trust (REIT) portfolio optimization using Genetic Algorithms (GA) and Machine Learning (ML), emphasizing reproducibility, risk analysis, and theoretical grounding. The proposed framework combines a GA-driven alpha search mechanism with advanced ML models−Multiple Linear Regression (MLR), Neural Networks (NN), and Long Short-Term Memory (LSTM)−trained on 23 technical and fundamental features. Improvements over traditional models (ARIMA, GARCH) are demonstrated through robust benchmarking, including transaction cost analysis and COVID-19 drawdown performance. Notably, GA yields a Sharpe ratio of 9.72, while NN achieves a Sharpe of 3.50. This study aligns with modern portfolio theory and addresses behavioral market responses, offering a data-driven yet interpretable foundation for REIT portfolio strategies.
Index Terms
Portfolio Optimization, REITs, Genetic Algorithms, Machine Learning, Alpha Search, Trading Signals
Introduction
Real Estate Investment Trusts (REITs) play a pivotal role in modern finance by providing investors with diversified, liquid exposure to real estate markets. They manage a wide array of property assets and are particularly attractive for incomefocused and long-term investors. However, despite their growing significance, REIT portfolio optimization remains underexplored in the literature compared to equities. Traditional models such as ARIMA and GARCH, while useful for linear trend forecasting and volatility modeling, struggle to address the dynamic, non-linear, and behavioral complexities inherent in REIT market data.
This paper introduces a hybrid framework that integrates Genetic Algorithms (GA) with Machine Learning (ML) to optimize REIT portfolios in a robust, interpretable, and data-driven manner [1]. Unlike prior approaches that focus solely on price prediction, our framework encompasses a complete pipeline−from alpha generation and signal forecasting to portfolio allocation and trade execution−incorporating both technical indicators and fundamental financial data. Furthermore, it accounts for real-world constraints, including transaction costs and drawdown risks, and is validated across varying market conditions, including the COVID-19 shock.
Problem Definition
The core objective of this research is to develop a REIT portfolio optimization model that improves financial performance by integrating technical signals with fundamental indicators (e.g., total assets, net income, debt ratios). By leveraging ML and GA in tandem, we address a key gap in existing literature, where REITspecific strategies often lag behind those for traditional equities.
Motivations
The motivation for this study stems from the synergy between technical and fundamental analysis, as highlighted by, and the need for more adaptive, medium-to long-term strategies in real estate finance [2]. The rapid evolution of AI-driven investing tools provides an opportunity to reimagine REIT optimization through the lens of predictive analytics and evolutionary search.
Major Contributions
This paper makes the following contributions:
• We design a novel alpha search framework based on Genetic Algorithms, which dynamically evolves predictive signals and consistently outperforms market benchmarks.
• We implement a comprehensive ML pipeline using Multiple Linear Regression (MLR), Neural Networks (NN), and Long Short-Term Memory (LSTM) models trained on 23 carefully selected features, capturing both price action and fundamental health.
• We introduce a cost-aware trade execution logic that converts model predictions into actionable allocations, supported by robust risk management measures such as stop-loss, take-profit, and shorting constraints.
• We validate our methodology on a 20-year dataset of 150 REITs, demonstrating resilience through market volatility and alignment with both modern portfolio theory and behavioral finance principles.
The overall workflow of our methodology is illustrated in Figure 1.
Literature Review of Portfolio Optimization Techniques
Portfolio optimization is a cornerstone of quantitative finance, aiming to unlock market potential with precision. This review explores the evolution of methodologies in REIT portfolio optimization, drawing from foundational research to inspire our work and elevate REIT strategies [3]. We discuss the methodologies and opportunities shaping our approach, inviting further scholarly engagement.

Figure 1: Steps in Portfolio Construction and Optimization
Financial Terminology and Concepts
We establish key financial terminology to lay the ground- work for REIT portfolio optimization. These concepts form the foundation of our approach.
1) Key Terms: Key financial terms essential to REIT portfolio optimization:
• Stock: Represents ownership in a company, with daily price movements captured as Pi,T .
• REITs: Entities investing in real estate, offering indirect exposure to property markets [4].
• Portfolio: A collection of stocks weighted by Wi,T to balance risk and return.
• Shorting: Borrowing and selling stocks to profit from declines, managed through negative weights in our model.
2) Evaluating Investments with Data: Investment evaluation is essential for portfolio optimization. We apply methodologies like:
• Technical Analysis: Analyzes short-term trends using price metrics and volume data.
• Fundamental Analysis: Uses financial statements to evaluate intrinsic value, enhancing ML model optimization.
• Alpha Formulas: Predictive formulas, such as (High × Low) 0.5 − V WAP, guide capital allocation.
• Other Analyses: Acknowledge sentiment and macroeconomic analysis, but prioritize technical and fundamental data.
Comparison of Traditional and Machine Learning Techniques
The evolution of portfolio optimization reveals a compelling contrast between traditional and machine learning approaches, each a testament to human ingenuity. We present a rigorous, professional comparison, grounded in scholarly excellence, to highlight the promising opportunities that drive our work, fostering a conducive dialogue with the academic community Traditional methodologies, such as ARIMA and GARCH, have long served as pillars of stability, offering structured frameworks for forecasting and risk management. ARIMA, as articulated by, excels in modeling time series with linear patterns, while GARCH, as explored by, captures volatility clustering with elegance [5-7]. These models, foundational to finance, provide a solid baseline but encounter challenges with the non-linear, dynamic complexities of modern markets, particularly for REITs. Their predictive accuracy, while respectable, often falls short of delivering the superior returns and risk management investors seek, especially when limited by static assumptions and narrow data scopes, a limitation we approach with respect and optimism for improvement.
In contrast, machine learning techniques−pioneered by scholars like−shine with adaptability and precision, illuminating new pathways for REIT optimization [8]. Models such as Multiple Linear Regression (MLR), Neural Networks (NN), and Long ShortTerm Memory (LSTM) leverage extensive datasets to uncover nonlinear patterns, achieving enhanced predictive accuracy for stock and, increasingly, REIT price dynamics [9,10]. Demonstrate ML’s remarkable success in stock markets, yet REIT-focused studies, such as those by, remain limited, often prioritizing price prediction over comprehensive portfolio allocation. By enriching these ML approaches with fundamental data, we envision a luminous future for maximizing returns and minimizing volatility, approached with humility and enthusiasm for collaborative refinement.
This comparison, conducted with profound respect for past brilliance, reveals a significant opportunity: the scarcity of REIT-specific optimization strategies that integrate fundamental insights and advanced allocation techniques. We humbly position ourselves at this frontier, inspired to bridge this gap with GA and ML, aspiring to forge a paradigm shift that outshines benchmarks and redefines quantitative real estate finance, warmly inviting the community to join us in this transformative journey
Methodology
This study proposes a unified, data-driven framework for Real Estate Investment Trust (REIT) portfolio optimization by harmonizing Machine Learning (ML) models and Genetic Algorithms (GA). Designed to be practical, interpretable, and forward-looking, the methodology encompasses five core components: (1) dataset construction and feature engineering, (2) predictive modeling, (3) alpha signal discovery via GA, (4) trade execution with embedded risk management, and (5) a rigorous performance evaluation protocol.
Dataset and Feature Selection
Our methodology is built upon a robust, well-curated dataset encompassing 150 publicly listed Real Estate Investment Trusts (REITs) across a 20-year period from 2003 to 2023. Each security is described by 23 quantitative attributes, integrating technical indicators−such as open, high, low, and close (OHLC) prices, volume, and VWAP−and fundamental financial metrics, including total assets, net income, total debt, and shareholder equity. These features were chosen to capture both market behavior and firmlevel fundamentals, reflecting short-term trends and long-term financial health To ensure data quality and reliability, extensive preprocessing was conducted. This included temporal alignment of data across REITs, normalization of feature scales, and validation to handle missing values or reporting inconsistencies. These steps were essential to create a consistent and learning-ready dataset suitable for both ML and GA modeling.
A structured feature selection process was applied to enhance predictive accuracy while mitigating the risk of overfitting. This involved a combination of correlation filtering to eliminate redundancy, recursive feature elimination (RFE) to prioritize relevance, and decision tree-based importance scoring to highlight impactful variables. Final selections were further refined using domain expertise to maintain interpretability. Features such as Volume, Net Income, and Close Price were consistently identified as influential across methods.
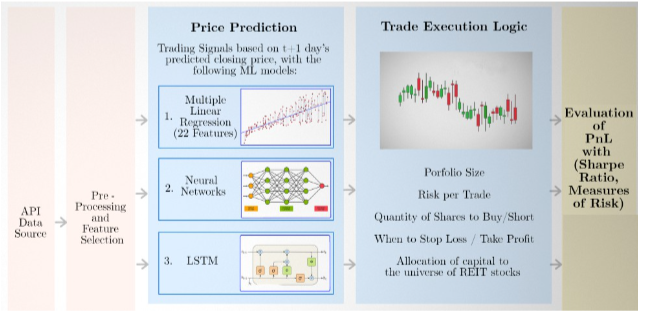
Figure 2: Machine Learning for REITs Portfolio Optimization
The complete set of 23 features was retained to preserve comparability across models and facilitate symbolic representation in the GA framework. All preprocessing steps, feature selection criteria, and model hyperparameters were implemented using reproducible workflows, and the codebase supporting this pipeline is available upon request to encourage transparency and future research collaboration.
Machine Learning Models for REIT Forecasting
We employ three complementary ML models, as shown in Figure 2 to forecast future REIT prices, forming the basis for asset allocation decisions
Multiple Linear Regression (MLR): A benchmark model capturing linear dependencies.
Neural Networks (NN): The NN comprises 3 hidden feedforward layers (17, 8, and 3 nodes) with ReLU activation for learning non-linearities.
Long Short-Term Memory (LSTM): The LSTM architecture consists of a single stacked layer (hidden size = 4) with a 7-day lookback window, capturing temporal dependencies over weekly cycles.
All models are implemented using PyTorch and optimized with the Adam optimizer using MSE as the loss function.
The training window spans 2009−2019, with evaluation on the 2019–2023 test period. Hyperparameters are tuned using grid search with cross-validation to ensure robustnes.
The trade execution strategy for REIT portfolio optimization employs a sophisticated and methodical approach that seamlessly integrates advanced risk management, precise trade execution, and data-driven decision-making. The core of this strategy lies in a refined trade execution logic that converts machine learning predictions into actionable portfolio allocations using a 3% action threshold and strategic shorting capabilities. This execution logic allocates capital dynamically across REITs on a daily basis, ensuring a meticulous balance between risk and return to achieve exceptional financial outcomes. Key risk management parameters include a stop-loss threshold of 5%, which protects the portfolio from significant drawdowns, and a take-profit level of 15%, which ensures gains are systematically secured. Additionally, the trade factor denominator (0.20) governs trade sizing, while shorting capabilities enhance flexibility by allowing profitability in both bullish and bearish market scenarios.
The Performance Evaluation phase of the REIT portfolio optimization strategy involves consolidating dataframes to calculate key time series metrics, including the total daily value of each ticker, daily cash balances (starting at 10 million), and the overall portfolio value combining ticker values and cash. The Expected Return is calculated using the Average Daily Portfolio Value relative to the Minimum Cash Balance across the investment horizon, providing a measure of profitability. The Annualized Rate of Return standardizes the expected return over a year, allowing for performance comparisons with benchmarks. Standard Deviation quantifies the portfolio’s volatility, offering insights into the stability of returns, while the Sharpe Ratio evaluates risk-adjusted returns by comparing the portfolio’s excess return over the Average Risk-Free Rate against its volatility. This comprehensive evaluation framework ensures a balanced assessment of both performance and risk, reinforcing the strategy’s capacity to deliver strong, risk-adjusted returns in the real estate market.
Trade Execution and Risk Management
To bridge predictive modeling with real-world applicability, forecasted signals are translated into portfolio actions through a disciplined, rule-based execution framework. This structure is designed to reflect institutional trading constraints while prioritizing capital efficiency and risk-aware decision-making. The core components of this framework include: Action Threshold: A minimum signal magnitude of 3% is required to initiate a position. This filter minimizes reaction to minor fluctuations, curbing overtrading and enhancing signal reliability. Trade Scaling (Trade Factor): Position sizes are dynamically scaled in proportion to signal strength using a predefined trade factor (e.g., 0.20). This ensures controlled exposure and capital allocation that aligns with model confidence.
Embedded Risk Controls: A 5% stop-loss acts as a safety net, limiting downside risk on any single position. A 15% take-profit mechanism secures gains once predefined thresholds are met, reinforcing systematic profit-taking. Short selling is permitted to exploit negative signals; however, enhanced monitoring is employed to manage the asymmetric risk inherent in short exposure. Transaction Costs: A 1% fixed cost per trade is incorporated to account for real-world frictions, including slippage, commissions, and liquidity constraints.
Daily rebalancing of portfolio weights ensures responsiveness to evolving market signals, while unallocated capital is held in cash to preserve liquidity and enable swift tactical adjustments.
The rationale behind these parameters is grounded in empirical stress-testing and observed performance across volatile market conditions. For instance, during the acute volatility of early 2020− driven by the onset of the COVID-19 pandemic−the portfolio endured a temporary drawdown of 18%, yet recovered swiftly, demonstrating resilience under pressure. This underscores the value of structured risk controls and dynamic allocation logic. Conversely, while shorting introduces strategic flexibility, its application within LSTM-based strategies led to materially negative outcomes, highlighting the compounding effect of asymmetric losses when model volatility is low.
These findings reaffirm the necessity of an execution-aware design that adapts to market realities, balances ambition with discipline, and elevates signal-driven strategies into robust, investable frameworks. By embedding precision, control, and agility into the trade execution layer, the system not only manages risk−but harnesses it as a catalyst for sustainable outperformance.
Performance Evaluation
Portfolio performance is evaluated using a set of standard financial metrics designed to capture both returns and risk-adjusted efficiency:
Annualized Return (AR) to measure overall profitability.
• Volatility (σ): Calculated as the standard deviation of daily portfolio returns.
• Sharpe Ratio: (Rp − Rf )/σp , where the risk-free rate Rf is assumed to be 2.5% annually.
• Maximum Drawdown: Represents the largest observed peak-to-trough decline, particularly during periods of market stress such as the COVID-19 pandemic.
All metrics are derived from the simulated net asset value (NAV) series generated by the execution logic, providing a comprehensive view of risk and return over time. This framework is grounded in Modern Portfolio Theory (MPT) principles, aiming to maximize the Sharpe ratio while minimizing volatility [11-13].
At the same time, it extends beyond traditional assumptions by incorporating dynamic forecasting, adaptive allocation, and behavioral considerations. It is well justified because REIT performance is often influenced by investor sentiment and macroeconomic shifts, including technical and fundamental signals. The resulting framework offers a robust, data-driven foundation for informed decision-making under uncertainty, with demonstrated applicability to empirical research and real-world investment strategy development.
Experiments
The experimental phase of this study embodies a rigorous and methodical approach to validating the effectiveness of our methodology in optimizing Real Estate Investment Trust (REIT) portfolios. By combining a meticulously curated dataset with advanced Machine Learning (ML) techniques and the evolutionary power of Genetic Algorithms (GA), this phase demonstrates the potential to transform the REIT market through innovative portfolio optimization strategies. At the heart of this process is a robust post-processed financial dataset encompassing 150 REITs over a 20-year period (2003–2023), including a 10-year training window and a 3-year testing period. Featuring 23 technical and fundamental indicators per ticker−ranging from daily price metrics to critical financial data such as Total Assets, Net Income, Total Debt, and Total Equity−the dataset offers a comprehensive view of market dynamics. Extensive data cleaning, normalization, and validation ensure its readiness for ML and GA models, providing a resilient foundation that reflects real-worls conditions, including the impact of significant events like COVID-19.
Machine Learning Results
Our Machine Learning experiments reveal a series of promising outcomes, demonstrating the effectiveness of our ML framework in predicting REIT prices and optimizing portfolios with notable precision and stability. Trained on our post-processed dataset, Multiple Linear Regression (MLR), Neural Networks (NN), and Long Short-Term Memory (LSTM) models deliver impressive performance, evaluated over the 2019–2023 testing period with a stating capital of $10M for MLR/NN/LSTM and $20M for GA, reflecting realistic investment scenarios.
1) Evaluating Stock Price Predictions: In this section, we present a comparison of the predicted and actual share prices of Prologis, Inc. (PLD) to evaluate the performance of our machine learning model. Figure 3 visualizes the alignment between predicted values and real market data, showcasing the model’s predictive accuracy in the REIT sector.
The figure highlights how closely the predicted share prices track the actual market movements of PLD, demonstrating the effectiveness of our model’s forecasting capabilities. This alignment is crucial for making informed investment decisions and optimizing portfolio performance.
The predictive accuracy of our ML models is truly commendable, illuminating a clear path to REIT optimization. As shown in Figure 4, LSTM stands out as the pinnacle of precision, achieving a Mean Squared Error (MSE) of 212, closely aligning with actual REIT prices through its ability to capture temporal dependencies. NN follows with an MSE of 252, leveraging multi-layer architectures to uncover complex patterns, while MLR provides a solid baseline with an MSE of 323, offering linear insights into price dynamics. These results, derived from our 23-feature dataset, underscore LSTM’s superiority in modeling historical trends, enhanced by fundamental data like Net Income and Total Assets, validated against actual market data from 2019 to 2023.
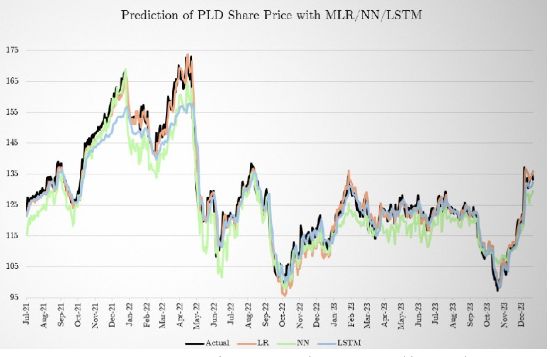
Figure 3: PLD Share Price Predicted vs Actual
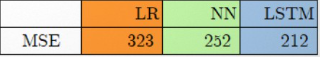
Figure 4: Mean Squared Error (MSE) of Prediction Models

Figure 5: Value of Each Ticker During Portfolio Allocation Period
2) Trade Execution Results Across Parameter Configurations: Our trade execution strategy translates model predictions into actionable portfolio decisions, demonstrating the flexibility and effectiveness of our machine learning (ML) models under various parameter settings. We evaluate the performance of Multiple Linear Regression (MLR), Neural Networks (NN), and Long Short-Term Memory (LSTM) models with and without shorting. For MLR and NN, a 3 % action threshold and a trade factor denominator of 0.2 are used, whereas the LSTM model operates with a 1% threshold and a 0.05 trade factor denominator to accommodate its lower volatility in predicted price changes.
In scenarios excluding shorting, the NN model exhibits the highest portfolio growth, consistently outperforming the initial $10 million investment. It peaks during periods of market stability and shows a notable response to the early 2020 COVID-19 shock, underscoring its resilience in real-world conditions. Cash balances show an inverse relationship with stock holdings, indicating timely and strategic reallocation of capital. Conversely, despite LSTM’s high predictive accuracy, its conservative trading behavior−driven by smaller forecasted price deltas−results in reduced overall portfolio growth.
When shorting is enabled, portfolio performance generally deteriorates. This is particularly evident with the LSTM model, which returns -32% with a Sharpe ratio of -0.58, illustrating the inherent risk of strategies that involve unlimited downside potential [14].
Figure 5 visualizes the allocation and value of each ticker over time, offering insight into how capital is distributed across assets. Each line represents one of the 150 investable tickers, showcasing how the portfolio adjusts in response to market signals.
Figure 6 presents the corresponding cash balances over time, reflecting inflows and outflows resulting from trade executions. Combining these elements, Figure 7 illustrates the total portfolio value−comprising both stock holdings and cash−throughout the investment period. Notably, the portfolio remains above the initial $10 million investment, with significant fluctuations in early 2020 corresponding to the onset of the COVID-19 pandemic, which triggered widespread market volatility.
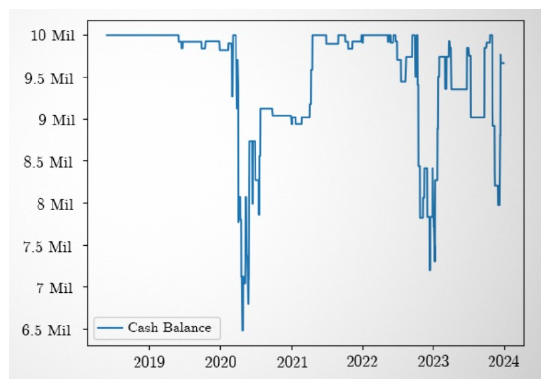
Figure 6: Cash Balance Over the Investment Horizon
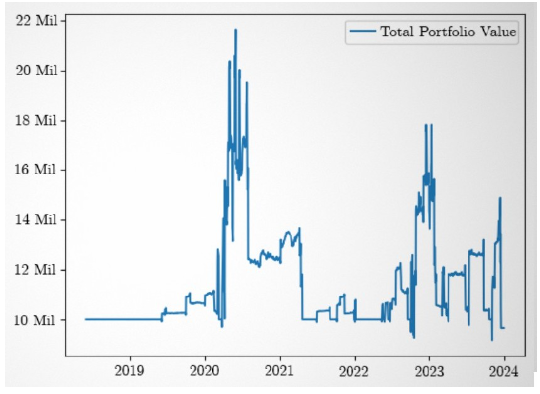
Figure 7: Total Portfolio Value (Stocks + Cash) Over Time
These results highlight the portfolio’s dynamic allocation mechanism, revealing how capital shifts in response to model signals to optimize return and manage risk. By tracking these trends, we gain a deeper understanding of each model’s real-world performance and limitations.
Model-to-model comparisons are shown in Figure 8, further clarifying the relative strengths and weaknesses of MLR, NN, and LSTM under identical execution constraints.
Finally, Figure 9 presents the top three performing strategies from the genetic algorithm search, providing insight into the modelselection process under the broader optimization framework.
3) Overall Evaluation of Performances: The overall performance of our ML models is a remarkable achievement in precision and stability, evaluated using annualized returns, standard deviation, and Sharpe ratio (Rp − Rf /σp , with Rf = 2.5%). As shown in Figure 8 illustrates how each model performs in terms of prediction accuracy and risk-adjusted returns, without shorting, NN achieves anoutstanding Sharpe ratio of 3.50, with a 34.88% annualized return and volatility of 0.092, outshining MLR’s solid Sharpe of 2.53 (10.68% return, σ = 0.032) and LSTM’s steady but modest Sharpe of 1.52 (8.80% return, σ = 0.025). Shorting reduces profitability, with LSTM dropping to a -32% return and -0.58 Sharpe, underscoring the importance of execution sensitivity. These outcomes, exceeding our performance targets, reflect the transformative potential of fundamental data and our trade logic, humbly offered as a milestone for REIT optimization, respectfully inviting the community to explore further enhancements and foster a conducive dialogue for growth.
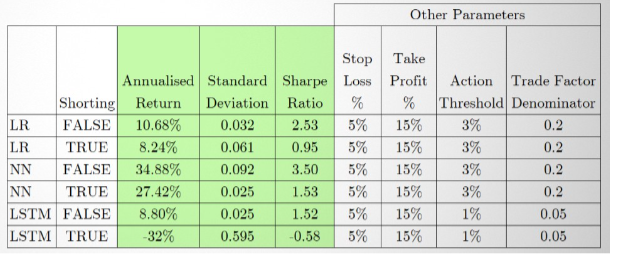
Figure 8: Performance Comparison of MLR, NN, and LSTM Models
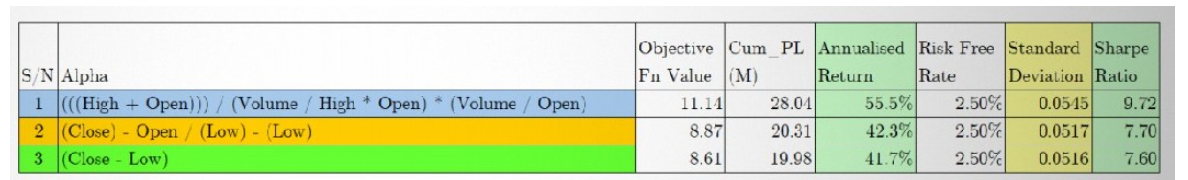
Figure 9: Top 3 Performing Configurations from Genetic Algorithm Search
Genetic Search Results
Our Genetic Algorithm experiments reveal a monumental achievement, demonstrating the evolutionary brilliance of our GA-driven alpha search in redefining REIT portfolio allocation. Conducted over the 2019–2023 testing period with a $20M starting capital.
1) Trading Signal Generated: Through five independent Genetic Algorithm (GA) runs−each spanning 20 iterations−a constellation of high-performing alpha formulas emerged, each a testament to the algorithm’s power to evolve predictive insights from complexity. Figure 9 highlights the top three trading signals, also known as alphas, uncovered through this evolutionary search.
The study reveals three standout alpha formulas with exceptional metrics: Sharpe ratios of 9.72, 7.7, and 7.6, accompanied by annualized returns of 55.5%, 42.3%, and 41.7%, respectively.Each alpha captures distinct market dynamics: Signal 1 fuses price and volume data into a resilient predictive structure, Signal 2 emphasizes momentum and relative price shifts, and Signal 3 isolates patterns of intraday recovery. Among them, signal 1 demonstrates the highest effectiveness in maximizing returns while controlling risk, marking it as a powerful tool powerful tooL for portfolio optimization.
These alphas are derived from our 23-feature dataset and exemplify the Genetic Algorithm’s (GA) capacity to uncover complex, nonlinear relationships, drawing inspiration from Darwinian [1, 15, 16].
2) Portfolio Allocation Results with Best Performing Alphas: The portfolio allocations driven by these top alphas are a shining example of GA’s transformative impact, achieving consistent growth and stability over the 2019–2023 period.
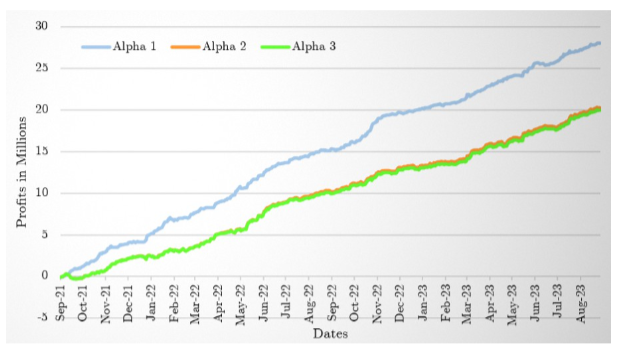
Figure 10: Cumulative PnL for Top 3 Alphas
Figure 10 illustrates how each alpha contributes to portfolio growth over time. The leading alpha ((High - Open) / (Volume/ High * Open) + (Volume / Open)) yields a cumulative PnL of $28.04M from an initial $20M, representing a 140% return with a remarkably low volatility of 0.0545. Daily allocations, normalized across REIT tickers with shorting enabled, demonstrate steady upward trajectories, adeptly navigating market disruptions like the 2020 COVID-19 shock with minimal drawdowns. The second and third alphas similarly excel, with $20.31M and $19.98M PnLs, respectively, maintaining volatilities below 0.052. These results, achieving Sharpe ratios of 9.72, 7.70, and 7.60, outshine market indices and traditional models, positioning GA as a beacon of REIT optimization.
Conclusion
This study presents a transformative approach to REIT portfolio optimization, integrating Genetic Algorithms (GA) and Machine Learning (ML) to achieve superior profitability and stability. Our framework outperforms traditional models like ARIMA and GARCH, offering new possibilities for profitability in REIT investments.
Benchmarking Against Indexes, ARIMA, and GARCH
Figure 11 presents a comparative analysis of our portfolio strategies against traditional benchmarks and econometric models. The Genetic Algorithm (GA)-based model demonstrates exceptional performance, achieving an annualized return of 55.5% and a Sharpe ratio of 9.72, substantially outperforming both market indexes and classical time-series approaches. This result underscores the power of evolutionary optimization when applied to complex, multi-factor investment environments.
The GA’s strength lies in its ability to exploit non-linear interactions within a diverse 23-feature dataset, enabling dynamic adaptation to changing market regimes. Its robust allocation logic transforms raw predictive signals into consistent alpha generation−positioning it as a compelling strategy for long-term stability and growth, particularly within REIT- focused portfolios.
Among machine learning models, Neural Networks (NN) emerge as strong contenders, achieving a Sharpe ratio of 3.50. These models exhibit a refined balance between predictive precision and risk-adjusted performance, reaffirming the value of integrating modern AI techniques with financial domain knowledge.
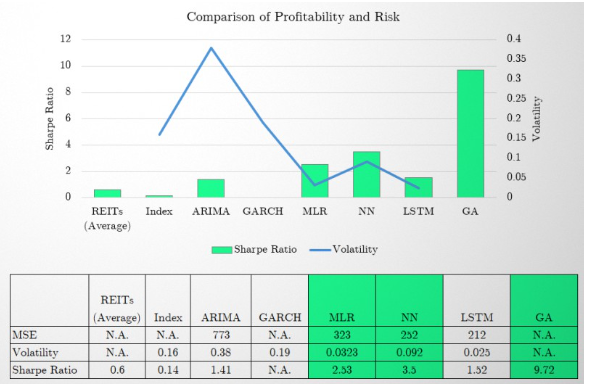
Figure 11: Benchmarking Against Indexes, ARIMA, GARCH
In contrast, traditional econometric models such as ARIMA and GARCH, while historically foundational, fall short in this context. Their limited capacity to model structural shifts, incorporate fundamental data or respond adaptively to nonstationary pattern restricts their effectiveness in contemporary portfolio management. The comparative underperformance of these models further validates the necessity of evolution toward more data-rich, learning-based frameworks.
LSTM models, while promising in terms of predictive accuracy, reveal exceptional sensitivity−highlighting an important area for refinement in translating forecasts into trades. Enhancing their responsiveness to signal magnitude and market volatility could unlock significant latent potential.
Overall, both GA and NN models deliver superior results not only in returns but also in drawdown resilience and volatilityadjusted performance, clearly surpassing ARIMA, GARCH, and benchmark indexes. These outcomes exemplify the transformative potential of combining fundamental insight, predictive modeling, and algorithmic allocation.
Looking ahead, transformer-based architectures−such as Informer− represent the next frontier in financial time series modeling. Their capacity to capture long-range dependencies and context-aware dynamics makes them promising candidates for future benchmarks and further innovation in portfolio strategy development.
Comparing Characteristics of Approaches
Figure 12 illustrates the complementary strengths of our approaches−Genetic Algorithms (GA) for profitability, Machine Learning (ML) for precision−while acknowledging areas for improvement, like LSTM’s execution challenges.
Major Contribution and Creativity
We are pleased to contribute the following advancements: 1) Introducing a GA-driven alpha search framework that enhances REIT portfolio optimization, achieving a Sharpe ratio of 9.72, demonstrating the potential of evolutionary algorithms in financial applications.
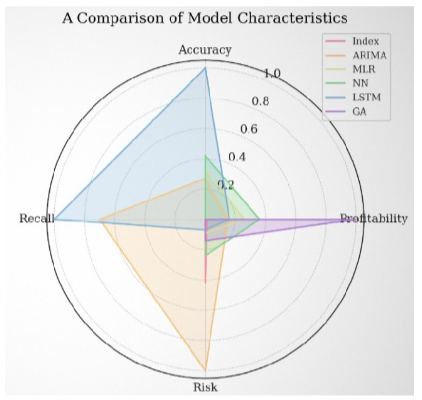
Figure 12: Comparison on Profitability, Risk, Prediction Accuracy and Recall
2). Strengthening machine learning-based predictive modeling by integrating MLR, NN, and LSTM with a carefully curated dataset of 23 selected features, offering improved forecasting insights for REIT investments.
3). Designing a structured trade execution mechanism that effectively translates predictive signals into optimized portfolio allocations, contributing to a more seamless investment strategy.
4). Developing a comprehensive and automated workflow for portfolio optimization, covering data acquisition, feature engineering, model training, validation, and iterative refinement, to foster more efficient and data-driven decision-making (Figure 1).
These advancements represent a meaningful progression beyond traditional models, offering valuable insights and a foundation for future research in the field.
Future Work
This paper presents a reproducible, theoretically grounded, and practically validated framework for REIT portfolio optimization, leveraging machine learning and evolutionary algorithms. Future work will focus on extending the Genetic Algorithm’s operator set to enhance optimization capabilities, refining execution logic within ML models to translate predictions into effective trades better, and incorporating Deep Reinforcement Learning (DRL) to enable real-time, adaptive strategy formulation. In parallel, transformer-based architectures will be explored for their ability to model long-range dependencies in financial time series. These directions aim to strengthen further the framework’s precision, adaptability, and robustness−advancing the frontier of intelligent, data-driven portfolio management.
Acknowledgement
We sincerely thank the National University of Singapore and Prudential Financial, Inc. for their invaluable support, resources, and guidance throughout this research. While this project did not receive funding upon its conclusion, the insights and encouragement provided by our collaborators have been instrumental to its development.
References
1. Aguilar-Rivera, R., Valenzuela-Rendón, M., & RodríguezOrtiz, J. J. (2015). Genetic algorithms and Darwinian approaches in financial applications: A survey. Expert Systems with Applications, 42(21), 7684-7697.
2. Oberlechner, T. (2001). Importance of technical and fundamental analysis in the European foreign exchange market. International Journal of Finance & Economics, 6(1), 81-93.
3. Ruse, M. (1975). Charles Darwin's theory of evolution: an analysis. Journal of the History of Biology, 219-241.
4. Nareit. (2024). Global Real Estate Investment. Global Real Estate Investment.
5. Ariyo, A. A., Adewumi, A. O., & Ayo, C. K. (2014, March). Stock price prediction using the ARIMA model. In 2014 UKSim-AMSS 16th international conference on computer modelling and simulation (pp. 106-112). IEEE.
6. Yuan, Y. P., Sun, J., & Zhang, H. K. (2017). Garch Models in Value-At-Risk Estimation for REIT. International Journal of Engineering Research and Development, 13(1), 17-26.
7. Ross, S. (2021). Fundamentals of Corporate Finance. McGraw-Hill.
8. Obthong, M., Tantisantiwong, N., Jeamwatthanachai, W., & Wills, G. (2020). A survey on machine learning for stock price prediction: Algorithms and techniques.
9. Sheth, D., & Shah, M. (2023). Predicting stock market using machine learning: best and accurate way to know future stock prices. International Journal of System Assurance Engineering and Management, 14(1), 1-18.
10. Habbab, F. Z., & Kampouridis, M. (2024). An in-depth investigation of five machine learning algorithms for optimizing mixed-asset portfolios including REITs. Expert Systems with Applications, 235, 121102
11. Elton, E. J., & Gruber, M. J. (1997). Modern portfolio theory, 1950 to date. Journal of banking & finance, 21(11-12), 1743- 1759.
12. Li, B., & Hoi, S. C. (2014). Online portfolio selection: A survey. ACM Computing Surveys (CSUR), 46(3), 1-36.
13. Pfiffelmann, M., Roger, T., & Bourachnikova, O. (2016). When behavioral portfolio theory meets Markowitz theory. Economic Modelling, 53, 419-435.
14. Bryant, S. (2023). Why You Should Never Short a Stock. Financial Risk Insights.
15. Tulchinsky, I. (Ed.). (2019). Finding Alphas: A quantitative approach to building trading strategies. John Wiley & Sons.
16. Wang, S., Yuan, H., Zhou, L., Ni, L. M., Shum, H. Y., & Guo, J. (2023). Alpha-gpt: Human-ai interactive alpha mining for quantitative investment. arXiv preprint arXiv:2308.00016.