
Advances in Machine Learning & Artificial Intelligence(AMLAI)
ISSN: 2769-545X | DOI: 10.33140/AMLAI

Research Article - (2025) Volume 6, Issue 1
Developing Indicators and Forecasting Demand for Enhanced Regional Community-Based Integrated Care Systems in Japan
Received Date: Dec 31, 2024 / Accepted Date: Feb 07, 2025 / Published Date: Feb 17, 2025
Copyright: ©2025 Kaede FUJITA, et al. This is an open-access article distributed under the terms of the Creative Commons Attribution License, which permits unrestricted use, distribution, and reproduction in any medium, provided the original author and source are credited.
Citation: FUJITA, K., ICHIKAWA, M. (2025). Developing Indicators and Forecasting Demand for Enhanced Regional Community-Based Integrated Care Systems in Japan. Adv Mach Lear Art Inte, 6(1), 01-12.
Abstract
This study evaluates the current state and future demand of the Community-based Integrated Care System (CICS) across Japan’s 1889 municipalities. Aimed at achieving a better CICS, this research developed indicators to evaluate the existing care structures within each municipality. Utilizing 73 indicators covering housing, medical care, long-term care, livelihood support, and preventive services, we conducted a comprehensive analysis to identify regional disparities and strengths. The indicators were visualized using radar charts and standardized to enable cross-regional comparisons. Future projections were made to estimate service and personnel demands, highlighting significant regional variations and emphasizing the need for region-specific policy planning and resource allocation. Our system allows for the evaluation and comparison of policies based on these indicators, determining their long-term significance. This research provides critical insights for policymakers and healthcare providers, offering a solid foundation for enhancing the CICS framework and supporting the creation of resilient, elderly-friendly communities throughout Japan.
Keywords
Policy Planning, Information Exchange, Geographic Information System (Gis), Geospatial Network Analytics
Introduction
The Ministry of Health, Labour and Welfare in Japan (MHLW) is promoting the establishment of the Community-based Integrated Care System (CICS) with the goal of maintaining the dignity and supporting the independent living of the elderly by 2025 [1]. This initiative aims to enable elderly individuals to continue living their lives in their familiar communities until the end of their lives. Due to the increase in opportunities for the elderly to use social welfare services caused by the declining birthrate, aging population, and nuclear families, this system requires comprehensive support and service provision in five interconnected fields: housing, healthcare, nursing care, living support, and prevention.
In Japan’s previous policies, the challenge was to secure local resources to meet the increasing and complex demand for services and reduce regional disparities in the quantity and quality of service provision. However, in recent years, due to population decline, there has been a noted decrease in the working population, which is the main provider of these services, necessitating the consideration of reducing the scale of operations [2].
Labor shortages are more severe in services requiring high expertise, such as medical services provided by doctors and nurses, and nursing care services provided by caregivers [3]. When expertise is not required, non-specialized workers are expected to provide services. Service providers with the same support targets can provide efficient services by cooperating. To build such a cross-disciplinary cooperative system, it is necessary to determine whether the current service provision is sufficient or lacking, requiring a quantitative understanding of CICS in each region [4]. Quantitative data serves as a basis for service providers to understand regional demand, decide on service withdrawal, and for administration to plan, guide, and regulate. Since CICS is mainly operated by private services, competition is inevitable. However, coexistence within the fields and cooperation, understanding the service provision system and characteristics of other fields, must be promoted.
Therefore, this study aims to capture the roles of each fields within CICS and develop indicators for the objective understanding of roles in the community. By demonstrating the quantitative evaluation of the five field, the study contributes to the promotion of CICS through service provision facilitated by mutual understanding between different fields. Additionally, by understanding the future demand for nursing care services, it provides a basis for determining whether long-term measures derived from the indicators are necessary.
Literature Review
To understand the research status on CICS in Japan, a quantitative analysis was conducted, examining both the content and characteristics of the literature to identify international trends. Figure 1 presents a bar graph showing the trends in publication numbers, with the horizontal axis representing the publication year and the vertical axis indicating the number of publications. Papers were collected from Scopus, the largest database of peer-reviewed literature, and CiNii, which covers major Japanese journals. Using the keywords ”community-based integrated care system,” relevant documents were selected, excluding book reviews.
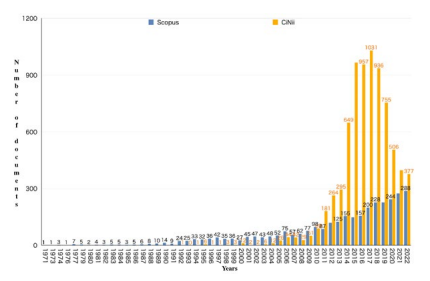
Figure 1: Annual Trends in the Number of Academic Papers on CICS
The first literature on CICS appeared in 1971. Across countries, CICS has been treated as a broad concept [5,6]. As shown by the blue graph in Figure 1, the number of publications has been increasing steadily. For example, the National Institute of Population and Social Security Research noted that the OECD’s 1996 report conceptualized "long-term care" by integrating "medical care" with "social care" [7]. The current mainstream of CICS varies based on the degree of integration and separation between medical and social care. These include reorganizing longterm care as community care, shifting to community care to reduce hospital stays, and promoting interprofessional collaboration.
Figure 2 shows the percentage of publications by fields in the 1970s, and Figure 3 shows the percentage since the 1980s. In the 1970s, the Medical field accounted for 76.69%. Since the 1980s, this share decreased to 59.2%, while Social Sciences accounted for 10.4%, Nursing 8.9%, Engineering 1.3%, and Computer Science 1.1%, reflecting a shift towards broader research fields. Quantitative and scientific methods are now being employed more frequently in CICS research.
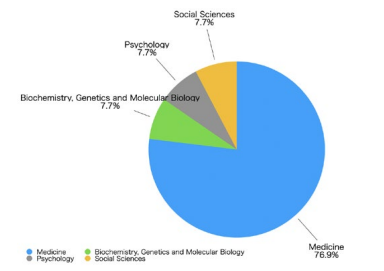
Figure 2: Proportion of documents by fields in the 1970s
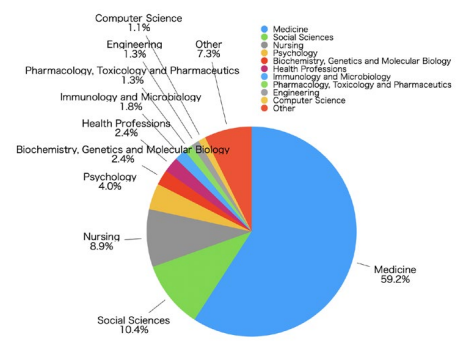
Figure 3: Proportion of documents by fields since the 1980s
As shown by the orange graph in Figure 1, research on CICS in Japan has also increased in recent years. The first literature on CICS in Japan appeared in 1992, and after a period of stagnation, publications increased following the introduction of long-term care insurance in 2000, peaking after the CICS formulation in 2014. This growth is driven by the increasing demand for elderly care and the development of related systems and policies.
Japan’s Community-based Integrated Care System has unique characteristics compared to other countries, particularly in its emphasis on building a system centered around long-term care to support the lives of the elderly. According to Lee, et al., Japan’s system focuses on the integration of long-term care, medical care, and welfare, with many services provided by private companies [8]. This contrasts with care models in countries like Canada and Germany, where public institutions play a leading role. Kodner also emphasized that in North American integrated care models, the coordination between medical care and long-term care is essential to improving the quality of elderly care [9]. This reveals inefficiencies and service gaps caused by the traditional medicalcentered system, showing that integrated care leads to more effective care delivery. Furthermore, to address Japan’s rapidly aging population, not only public institutions but also regional functional division of roles has been promoted. However, with the expansion of long-term care services provided by private companies, government regulation and guidance have become indispensable. In this respect, Japan’s approach has distinctive features compared to other countries Lee, et al [8].
Many studies on the Community-based Integrated Care System focus on healthcare and long-term care, while research on comprehensive coordination across other fields and the entire region has not sufficiently progressed. Tsuruta pointed out that research on the Community-based Integrated Care System has primarily concentrated on healthcare and long-term care, especially in the metropolitan areas, and highlighted the lack of policy development regarding life support and living environments as a key issue [10]. Japan’s rapid aging population has brought international attention to the need for developing a robust Community-based Integrated Care System. However, research has been lagging behind policy developments, and there is an increasing need for a cross-sectoral and quantitative approach Tsuruta, 2017. The author believes that evidence-based research to support policy formation and improvement will become increasingly important in the future. Furthermore, an investigation of international literature found no studies in either Japanese or English that comprehensively and quantitatively evaluated the Community-based Integrated Care System. Meanwhile, in localized policy discussions, quantitative policy proposals based on statistical and geographical data are being made, suggesting that similar methods should be introduced into the evaluation of the Community-based Integrated Care System.
Research Context
This study aims to achieve a better CICS by developing indicators to evaluate the current CICS structures in various municipalities. Additionally, it forecasts future demand for services and personnel, and constructs a system that enables the evaluation and comparison of policies based on these indicators to determine their long-term significance. The objective is to propose an integrated analysis method for demand-supply evaluation that considers the service supply and demand in each municipality and contributes to policy leading system design.
This research consists of two main parts: current analysis and future analysis. In the current analysis, the objective is to understand the comprehensive CICS in each municipality by examining objective indicators using open data and proposing a cross-sectional analysis method. In the future analysis, established supply and demand forecasting methods will be used to estimate the future needs of each municipality, taking regional differences into account. The goal is to propose an integrated analysis method based on both current and future analyses.
Methodology and Data
Current Analysis
This study, based on the Long-Term Care Insurance Project Plan Ministry of Health et al., 2019, defines the roles of the five sectors within CICS and establishes quantitative evaluation indicators [11]. Indicators are shown in Figure 1. The insurers responsible for managing medical and long-term care expenses are municipalities, including districts within ordinance-designated cities. Therefore, this study targets 1,889 municipalities.
The method for calculating the CICS indicators is shown in Figure 4. Since open data is collected from various sources, the units of aggregation differ. The aggregation units are municipalities, districts of ordinance-designated cities, and insurers. Insurers include wide-area unions formed by multiple municipalities, resulting in a total of 1,571 insurers. Due to inconsistencies in data aggregation units, the indicators for housing, healthcare, and longterm care are standardized to 1,889 divisions, while life support and prevention indicators are calculated based on 1,741 divisions. For visualization, all data is aligned with 1,889 divisions.
When standardizing these regional divisions, the population and the number of certified long-term care recipients were either aggregated or apportioned. In the aggregation process, the population of districts outside Tokyo was summed at the city level. In the apportionment process, the number of certified long-term care recipients was distributed among cities or districts based on the population ratio of each.
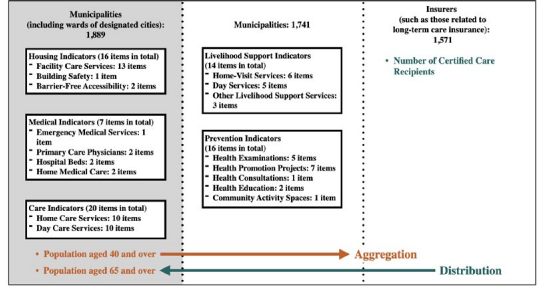
Figure 4: Aggregation units for CICS indicators
The data sources for the variables used are listed in Table 1
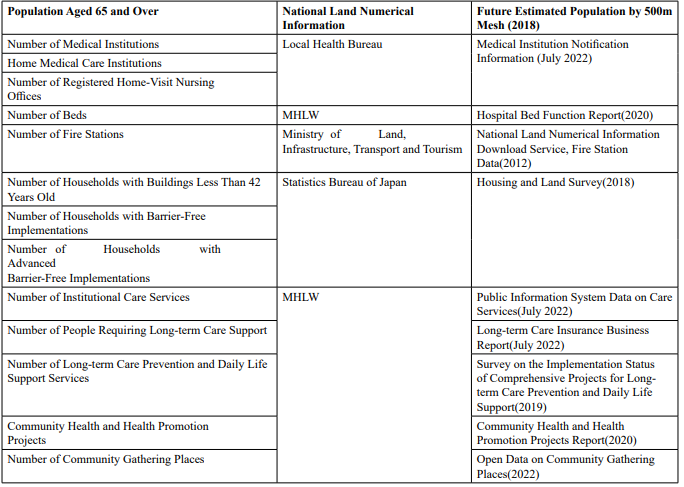
Table 1: Data Sources Used for Medical Indicators
Accessibility was evaluated by whether facilities could be reached within a certain distance. Residents within this distance were considered the covered population. The ratio of this covered population to the total population was used as an indicator of accessibility. The analysis method involved generating service areas using ArcGIS Pro’s network analysis and calculating the covered population using MLIT’s 500m Mesh Future Population Projections (2020).
Housing Indicator
The purpose of housing in CICS is to provide a foundation for the elderly to live independent lives in their familiar communities. Housing indicators are evaluated based on building safety, barrierfree accessibility, advanced barrier-free accessibility, and the adequacy of facility-based long-term care services.
Building safety was assessed by calculating the ratio of households in buildings less than 42 years old to the total number of households, which allowed for an understanding of the proportion of relatively new buildings. Barrier-free accessibility was evaluated by calculating the ratio of households with basic barrierfree modifications to the total number of households, enabling an assessment of the progress in barrier-free housing. Advanced barrier-free accessibility was determined by calculating the ratio of households with advanced barrier-free modifications to the total number of households, providing insight into the proportion of homes with more advanced barrier-free adaptations. The number of facility-based long-term care services per capita was calculated by dividing the number of certified care recipients aged 65 and over by the number of facility-based long-term care services, allowing for an assessment of the adequacy of care facilities for the elderly population.
Medical Indicator
The purpose of medical care within CICS is to promote the effective and efficient allocation of human resources and facilities according to the functions of medical services. This aims to establish a system where patients can receive high-quality medical services appropriate to their condition, covering primary care, emergency care, and chronic care. The medical indicators include accessibility to primary care physicians, the number of general and long-term care beds, and those relevant items from the 5 diseases, 5 projects, and home medical care outlined in the medical plan.
Accessibility to primary care physicians was calculated as the population coverage rate, representing the proportion of elderly individuals living within a typical walking distance of 500 meters from medical institutions that offer specialties other than psychiatry, psychosomatic medicine, and psychosomatic internal medicine. The indicator for the number of beds was determined by calculating the population per number of general and longterm care beds. General beds provide intensive care for patients with acute exacerbations or unstable conditions, while long-term care beds are for patients with stable conditions who require long-term care. The indicator for medical institutions addressing the 5 diseases prevalent among the elderly (cancer, stroke, heart disease, diabetes, and psychiatric disorders) was based on the population coverage rate within 500 meters of medical institutions offering relevant specialties, such as internal medicine, urology, ophthalmology, surgery, psychiatry, gastroenterological surgery, vascular surgery, cardiology, neurosurgery, and neurology. Accessibility to emergency medical services was calculated as the population coverage rate within a 15-minute drive from fire stations equipped with ambulances. The 15-minute rule is a recognized standard in emergency medical care, emphasizing that the time taken for an ambulance to arrive at the scene is a critical factor in determining survival, as exemplified by the Callar’s mortality rate curve. The indicator for home medical care was based on the number of medical institutions registered as providing home care, as listed in the medical institution notification information (as of July 2022). This includes institutions with basic medical service acceptance codes such as ”Support Clinic 1,” ”Support Clinic 2,” ”Support Clinic 3,” ”Support Hospital 1,” ”Support Hospital 2,” ”Support Hospital 3,” and ”On-site Clinic,” as well as those listed in the notified acceptance specified visiting nursing station list. These were calculated per population to assess the adequacy of home medical care services.
Care indicator
The purpose of caregiving within CICS is to support the independent living of the elderly by providing care and rehabilitation tailored to their individual needs. The caregiving indicators were evaluated based on the adequacy of night-time home-visit care, regular and on-demand home-visit care nursing, small-scale multifunctional in-home care, specified welfare equipment sales, and nursing small-scale multifunctional in-home care.
To calculate the number of caregiving services per population by service type, the number of caregiving support recipients aged 65 and over was divided by the number of caregiving service
Livelihood Support Indicator
He purpose of livelihood support within CICS is to provide services necessary to improve the quality of life for the elderly. The life support indicators were evaluated based on the comprehensiveness of services such as Visiting Services Equivalent to Previous Services, Visiting Service A, Visiting Service B, Visiting Service C, and Visiting Service D. These services are categorized by letters according to the method of organization, such as service provider designation, outsourcing, or subsidies, as well as The usage criteria refer to whether users are receiving preventive benefits or whether eligibility is determined by independent standards. These classifications address diverse life support needs based on the care level of users and the available service unit prices. This approach clarifies the role of each service within the Community-based Integrated Care System, ensuring appropriate support tailored to the condition of users and the characteristics of the region.
To calculate the number of livelihood support services per population by service type, the number of caregiving support recipients aged 65 and over was divided by the number of livelihood support services.
Prevention Indicator
The purpose of prevention within CICS is to promote social participation among the elderly and to maintain their health and prevent the need for long-term care. The prevention indicators were evaluated based on the implementation status of health checkups, including those for stomach cancer, lung cancer, colorectal cancer, and cervical cancer. To calculate the implementation rate of each health checkup, the number of health checkups conducted was divided by the number of target individuals for each respective checkup.
Deviation and Visualization
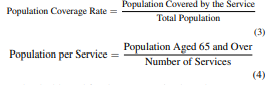
To facilitate comparison across multiple cities, raw values were converted to standard scores and visualized using radar charts. The reason for using radar charts is that they allow for multiple indicators to be compared at a glance, making it easier to visually grasp the characteristics and balance of each region. In particular, they make the strengths and weaknesses of each indicator clear, which is suitable for comparing between regions and identifying the specific strengths and weaknesses that each region possesses. Calculations were performed using Python 3.0, and visualization was done with Tableau Desktop 2022.2. Additionally, mean values understand each city’s strengths and weaknesses. The formulas are provided in Equation (1) and Equation (2).
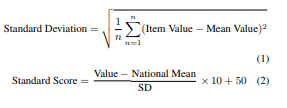
The reason for standardizing the values is that the indicators vary in units such as rates and coverage areas, allowing for crossmunicipal evaluations and comparisons. The formulas used are Equation (3) and Equation (4).
The dashboard for the community-based care system indicators is shown in Figure 5. To understand the current status of each sector, we visualized the indicators using radar charts. Tableau Desktop 2023.3 was used to create the dashboard. This enabled the identification of each region’s strengths and weaknesses. Additionally, by overlaying multiple municipalities, it became possible to compare regions, which can also be used to examine collaboration between prefectures and neighboring areas. The examples of application are discussed in Chapter 5, Future Analysis.

Figure 5: Dashboard on community-based care system indicators
Future Analysis
Demand Calculation Methodology
Future demand for care services and care workers was estimated and visualized. To evaluate the items related to care services within the CICS indicators, we used five items from the housing indicators (facility care services) and twenty items from the care indicators (home care services, day care services). The purpose of demand estimation was to understand the future service need of each municipality and to assist in effective policy formulation. The estimation method was based on previous research by MRI Research Associates Inc., and the estimation was conducted for 1,889 municipalities [12]. The estimation methods for each variable are shown in Figure 6. In Figure 6, the solid lines indicate the variables being estimated, and the dotted lines indicate the variables used as parameters during the estimation.
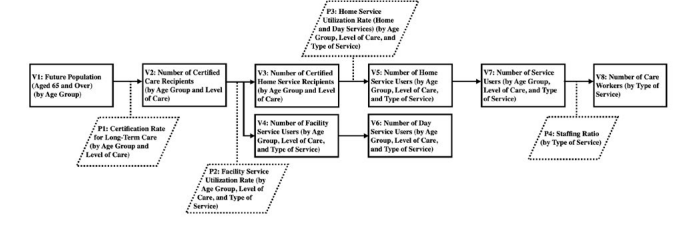
Figure 6: Procedure for estimating demand for care services
Future Population (V1 in Figure 6) was calculated using agespecific data from the "Regional Population Projections for Japan (2018 Estimate) NIPSSR, 2018" focusing on the population aged 65 and older [13]. The regional divisions include 1,810 municipalities (Tokyo’s 23 special wards, 128 districts of 12 ordinance-designated cities, 778 cities, 713 towns, and 168 villages). This study targeted 1,889 municipalities. For ordinance-designated cities without future district-level data, 2015 population data was used.
The number of certified care-needing individuals (V2) was calculated by multiplying the future population (V1) by the careneeding certification rate (P1), using age-group-specific ratios (ages 65–74 and 75+). Certification rates were determined by dividing the number of certified individuals by the population in those age groups.
The number of facility service users (V4) was calculated by multiplying the estimated number of certified care-needing individuals (V2) by the facility service receipt rate (P2). Facility services include four types: long-term care medical, health, welfare, and medical facilities. Receipt rates were calculated by dividing the number of users by the number of certified care recipients, categorized by care level and service type.
The number of home service recipients (V3) was determined by subtracting the number of facility service users (V4) from the number of certified care-needing individuals (V2).
The number of home care (V5) and day care (V6) service users was calculated by applying the respective receipt rates (P3) to the estimated home service recipients (V3). Home care services include preventive care, home care support, home medical guidance, multifunctional home care, and other services. Day care services include short-term stay care, regional long-term care, and dementia care services.
The total number of service users (V7) was calculated by aggregating the facility service users (V4) and home and day care users (V5 and V6). The number of care workers (V8) was calculated by multiplying the total number of service users by staffing ratios. Staffing ratios, shown in Table 2, were based on actual headcounts, reflecting the high proportion of non-regular workers in the care sector.
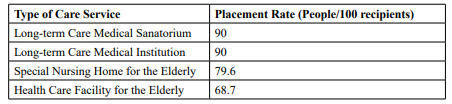
Table 2: Placement Rate
The indicators created in this study involved adjusting data to account for differences in aggregation units of publicly available data. As a result, the comparative values cannot be treated as absolute. This issue may be addressed in the future if data related to the Community-based Integrated Care System is investigated and published using unified aggregation units.
Additionally, while a comparison of medical indicators was conducted using three cities in Saitama Prefecture, it is possible to compare any number of municipalities with each other. However, it is necessary to consider whether the values presented in this study are appropriate for each of the 1,900 municipalities, taking into account the complementary relationships between services and the characteristics of each municipality (e.g., population distribution and composition). This issue will be addressed in future research.
Result and Visualization
The results calculated based on the methodology in section 4.1 were visualized in the dashboard shown in Figure7. The visualized items are as follows:
• Map: Geographical information with an interface for area selection (prefecture, city, municipality).
• Number of Service Users by Type of Care: Bar graph showing annual changes in care service demand for 2015, 2020, 2030, and 2040.
• Proportion of Care Service Types: Pie chart displaying the proportion of facility services, home care services, and homebased services.
• Required Number of Care Workers by Type of Service: Bar graph showing required care workers for 2015, 2020, 2030, and 2040, color-coded by type of service.
The future demand for care services was visualized based on the number of service users and care workers. The number of service users was visualized using pie and bar charts to show changes over time. The service users were categorized by type of care service (facility services, home care services, home-based services) to allow for understanding based on the method of service provision, facilitating the prioritization of policies. Additionally, the required number of care workers was visualized using bar charts to show changes over time based on the demand. The number of care workers needed for each type of service varies, allowing for the visualization of changes due to demographic shifts.
This visualization made it possible to visually grasp the provision status of care services in each municipality. It enabled the annual tracking of changes in the demand and supply of care services, providing a basis for planning future workforce allocations. Moreover, the visualization allowed policymakers and regional care service providers to understand the characteristics and future needs of each region, enabling them to formulate efficient and effective measures.
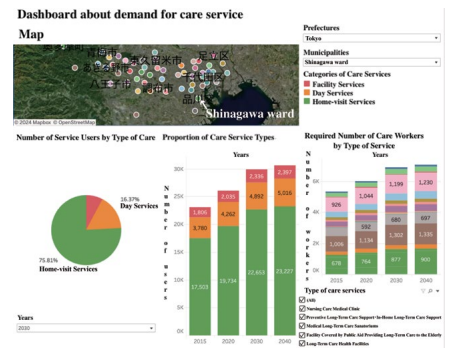
Figure 7: Dashboard about demand for care services
Health care indicators in the Community Comprehensive Care Index
Using the constructed system, we analyzed and evaluated the characteristics of CICS across municipalities nationwide using seven indicators: emergency medical care, primary care physicians, the 5 diseases, general hospital beds, long-term care beds, home medical care, and home-visit nursing care.
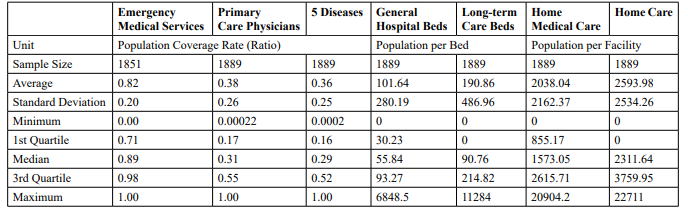
Table 3: Basic Statistics for Medical Indicators
The basic statistics presented in the table include the sample size, mean, standard deviation, minimum, first quartile, median, third quartile, and maximum. These data were aggregated from municipalities, including wards of designated cities, with a total sample size of 1,889 municipalities.
The Figure 8 shows the results of multiple municipalities’ scores displayed on a radar chart. In this paper, as a case study of indicator utilization, we displayed and compared Saitama City’s Omiya Ward, Chichibu City, and Wako City in Saitama Prefecture. This allows for the evaluation and comparison of medical indicators among the targeted municipalities.
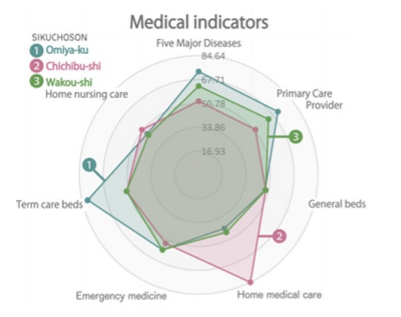
Figure 8: Radar chart of Omiya Ward, Chichibu C
In Saitama City’s Omiya Ward, emergency medical care, accessibility to primary care physicians, accessibility to the 5 diseases, and the number of long-term care beds are all higher than the national average (standard score 50). Wako City also shows high accessibility ratings. However, the evaluations for homevisit nursing and home medical care are lower than the national average. On the other hand, Chichibu City has lower accessibility ratings than the national average but shows higher scores in home medical care.
The Figure 9 shows box plots of actual values for each medical indicator by prefecture, allowing an understanding of the current status and characteristics of municipalities within each prefecture. Outliers were excluded from the box plots for general beds, long-term care beds, and home medical care. The results reveal significant variations in the number of beds at the municipal level due to prefectural adjustments, while the distribution of home medical care and home-visit nursing care facilities is uneven, with many municipalities lacking these services.
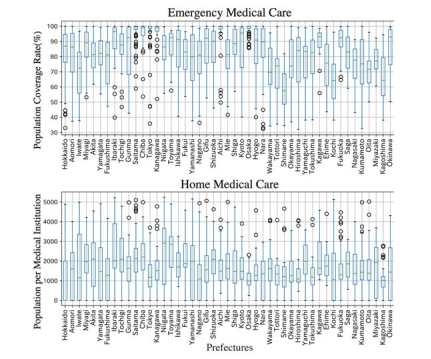
Figure 9: Health care indicators by prefecture Box-and-whisker diagram
For emergency medical care, distinct features were observed, such as regions with high means and medians, regions with small standard deviations and uniform distribution, and regions with large differences between maximum and minimum values indicating wide score distribution. Geographic distribution, including urban formation and the dispersal of habitable areas, significantly influences these characteristics.
In terms of primary care physicians and the 5 diseases, there were fewer outliers compared to emergency medical care, indicating that each prefecture comprises municipalities with different characteristics. Due to the accessibility evaluation standard being within a 500m walking distance, prefectures with high scores in emergency medical care also have many regions with similarly high scores but are affected by municipalities with low average and median values.
Home medical care and home-visit nursing care show relatively uniform distribution in many prefectures, though some, like Osaka and Hiroshima, have narrower distributions, suggesting differences in the promotion of these services at the municipal level.
General and long-term care beds exhibit relatively uniform distribution across prefectures, with a wide range between maximum and median values. Particularly for long-term care beds, the wide distribution range suggests that many municipalities have few or no such beds compared to general care beds.
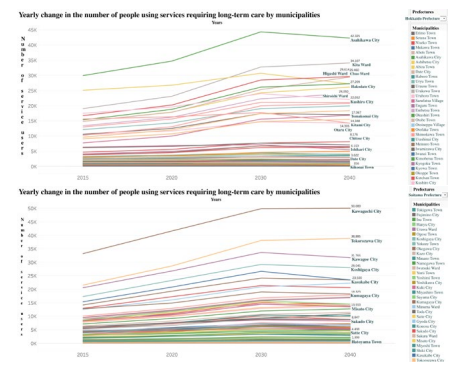
Figure 10: Number of service users in Hokkaido and Saitama Prefecture over years 2015 to 2040
Future Analysis for Care Services
Figure 10 show the annual trends of care service users explained in section 4.2.1 for Hokkaido and Saitama Prefecture. In Figure 10, there is a gradual decrease in demand after peaking in 2030. However, there are variations in the demand trends for facility services among different municipalities. Specifically, some regions show a gradual decrease in demand after peaking in 2030, others continue to increase until 2040, and some show a decrease in demand as early as 2030.The annual trends in the number of required care workers indicate that the number of care workers is increasing across all types of care services as we approach the peak in 2030. Particularly notable increases are seen in facility services, specific facility resident care, and community-based care facilities for elderly residents. These services are characterized by a high proportion of users with severe care needs, which necessitates a higher staffing ratio.
In this study, future projections of the long-term care service system were made for each municipality, demonstrating the potential for these projections to be utilized in policy evaluation, such as assessing the validity of policies and identifying challenges. However, these projections are based on estimates, and the situation may change significantly depending on various scenarios when the policies are implemented. This is a limitation of the study, and it is necessary to consider the uncertainty of these projections. Therefore, future research should explore methodologies that can more precisely account for interactions between indicators.
Conclusion
In evaluating CICS indicators, 73 were assessed across 1,889 municipalities, revealing biases and strengths in each region and enabling comparisons with others. This understanding aids more effective policy planning and resource allocation. Future projections considered demographic shifts and service usage in these municipalities, predicting an increase in certified care recipients, peaking around 2030. The growing population aged 75 and over suggests a rise in severely care-dependent individuals, increasing demand for care services and workers. The surge in facility service users was particularly notable, as severely caredependent individuals require highly staffed care services. Since population structure and service usage patterns vary, the future burden of care service demand differs by region. For example, as shown in Figure 10, some regions experience a decline after 2030, while others continue to see demand rise until 2040. This highlights the need for region-specific policies based on local characteristics.
This study has limitations, such as the inability to fully assess collaboration and resource sharing between municipalities, and the interactions between indicators. Future research will need more detailed data collection and analysis to address these issues.
Overall, this study provides foundational data for municipalities to operate CICS effectively and achieve sustainable elderly care. By utilizing this data, regions can plan and implement tailored policies, contributing to communities where elderly residents can live with peace of mind.
Lastly, the Dashboard about demand for care services and the Dashboard on community-based care system indicators are available on the Shibaura Institute of Technology, Laboratory for Social System Science website: https://www.ds.se.shibaura-it. ac.jp/ [14].
References
1. Ministry of Health, L., & Welfare. (2016). About the community-based integrated care system.
2. Ministry of Health, L., & Welfare. (2022). 2022 white paper on health, labour and welfare.
3. Ministry of Health, L., & Welfare. (2010). Survey on the required number of physicians.
4. Ministry of Health, L., & Welfare. (2019). Survey of longterm care service facilities and businesses.
5. Reference, O. (2022). Community-based integrated care system.
6. Agency, J. I. C. (2018). Community-based integrated care system.
7. NIPSSR. (2008). Overseas social security research. Overseas Social Security Research, 162, 2-3.
8. Lee, J., Yamazaki, M., & Tanaka, T. (2022). The role of private companies in japan’s community-based integrated care system: A comparative study with other countries. Journal of Comparative Health Policy, 15(2), 45-60.
9. Kodner, D. L., & Spreeuwenberg, C. (2002). Integrated care: meaning, logic, applications, and implications–a discussion paper. International journal of integrated care, 2.
10. Tsuruta, Y. (2017). Trends and future issues in regional comprehensive care research. Journal of the Japan Society of Health Economics, 33(1), 33–40.
11. Ministry of Health, L., Welfare, D. o. H., & for the Elderly, W. (2019). Long-term care insurance (support) program plan.
12. MRA. (2014). Survey and research project report on the development of workforce supply and demand projection worksheets for long-term care personnel.
13. NIPSSR. (2018). Regional population projections for japan: 2018 projection (by age group).
14. Fujita, K., & Ichikawa, M. (2025). Developing Indicators and Forecasting Demand for Enhanced Regional CommunityBased Integrated Care Systems in Japan.