Journal of Data Analytics and Engineering Decision Making(JDAEDM)
ISSN: 2998-8713 | DOI: 10.33140/JDAEDM


Research Article - (2024) Volume 1, Issue 2
Control Protocol for Hybrid Multiple on-Grid System Powered by Renewable Energy Sources
Received Date: Jul 05, 2024 / Accepted Date: Aug 01, 2024 / Published Date: Aug 13, 2024
Copyright: ©2024 Carlos Armenta-Deu, et al. This is an open-access article distributed under the terms of the Creative Commons Attribution License, which permits unrestricted use, distribution, and reproduction in any medium, provided the original author and source are credited.
Citation: Deu, C. A., Diaz, S. (2024). Control Protocol for Hybrid Multiple on-Grid System Powered by Renewable Energy Sources. J Data Analytic Eng Decision Making, 1(2), 01-23.
Abstract
This paper focuses on designing and analyzing a control protocol for multiple on-grid systems powered by three renewable energy sources, photovoltaic, biomass, and hydroelectric, covering energy demand in the domestic, commercial, or industrial sectors. The system connects to the grid to maintain a null energy balance, injecting the excess of generated energy or covering the energy unbalance with power from the grid. The photovoltaic array and biomass facility play the principal power source for energy demand coverage, with hydroelectric as a secondary source during night or cloudy periods. The simulated system operates near a river flow to facilitate hydroelectric generation. Still, it can also work in places far from a water flow by simply using two water reservoirs to pump and turbinate water to and from each other depending on the energy balance, excess or deficit. The developed analysis shows the system feasibility and economic profitability in small, medium, and large communities with available solar and hydro resources and grid connections to exchange energy when necessary. The correct design of the hybrid dual system provides a reliable method to self-cover energy demand at optimum performance, promoting the use of local renewable resources, reducing dependence on conventional power sources, and limiting the carbon footprint. The paper shows how to optimize the hybrid dual system operation by applying specific protocols for power management, ensuring an efficient energy supply, and guaranteeing power demand coverage.
Introduction
The energetic and environmental changes produced in the past decades determine humanity's future development. Anthropogenic atmosphere change represents a world-scale challenge with unexpected consequences and negative impacts [1]. On the other hand, the world energy scenario shows the predominance of fossil fuels up to 100% in some countries and more than 2/3 of the total power supply on the planet's average. This situation is not sustainable because of the progressive decrease of fossil fuel reserves [2]. Despite the continuous search for new oil and gas f ields, the balance is negative, which brings fossil fuel reserves closer to depletion in the not-very-long term; therefore, it is mandatory to replace conventional power sources with renewable energies in all human activity sectors, residential, commercial, industrial, and transportation.
Growing population, especially in countries agglutinating more than half of the planet's inhabitants and achieving a high energy demand rate, like China, India, Indonesia, Brazil, and others, aggravates the problem of fossil fuel consumption and GHG emissions since they tend to use cheap and easy access technology to produce the energy they need. Considering the average yearly population and energy consumption growth, the experts expect that the fossil fuel reserves will deplete in about a century, more precisely 54 years for oil, 49 years for natural gas, and 139 for coal [3-5]. These predictions, however, may be erroneous if the population growth confirms the trending change starting in 1963, which predicts a growth rate reduction from 2.3% to 0.9%. Unfortunately, we expect to reach 9.7 billion people in 2050 and 10.43 billion in 2086 [6].
Applying a simple numerical model, if we consider the total annual energy requirement, R, for a population of N people, the yearly average per capita energy use, E, is the quotient between R and N [7]. Nevertheless, the per capita energy consumption changes with time in a complex manner that depends on many factors like welfare development, access to technological devices, appliances and facilities, and new energy consumption habits; thus, producing the per capita gross national product, S, which linearly depends on E through a factor f. Combining all these factors, applying a yearly average energy-use growth of 3.5%, and retrieving data for population growth, we have:

A continuous energy-use growth of 5.4% per year is not sustainable; therefore, we should remedy it in the short to medium term, replacing conventional fossil fuel power sources with renewable energy systems. Renewable sources produce lower environmental impact and carbon footprint but suffer from low power density, lack of predictability, complex storage systems, and intermittency (nighttime and cloudy periods) [8-11]. On the other hand, the fast implementation of renewable power plants may saturate the grid capacity if not adapted to the new energy matrix, with unexpected and negative consequences. The efficient management of renewable energy generation is a challenge modern society faces if we want to operate renewable power plants in optimum conditions. To this goal, goal, we design a specific protocol based on a control algorithm that regulates the power input from different renewable sources, maintaining a null balance between power generation and energy consumption. The grid connection allows a two-way electric current flow, compensating for energy unbalances.
Fundamentals
Solar
Solar photovoltaic generation depends on the type and size of PV panels and solar radiation level. For standard operating conditions, with solar radiation of 1000 W/m2 and a working temperature of 25° C, a PV panel supplies the maximum output power (Ppv). Because of the limited operating voltage and current of PV panels, the PV array combines panels in series and parallel to achieve the required working values; mathematically:

Piv is the output power of a single panel, Ls is the number of serial panels, and Lp is the array rows number.
We define the Ls and Lp values depending on the operating voltage and current, which should match the load. In domestic applications, the working voltage is 220 V for the European market and 110 V for the American one. Since modern technology allows manufacturing PV panels of relatively high voltage, up to 48 V for 96 cell panels [12], the number of serial panels is Ls = 5 for the European market and Ls = 3 for the American one. The row's number depends on the required power according to the expression:

Pload and PL are the load requirement power and transmission line power losses, V'op is the PV array working voltage, and (Ipv)i' is the maximum current generated by a single PV panel.
Load power depends on the unitary element power and number of elements of the same type; therefore:

P and f are the element power and occurrence frequency.
Transmission power losses derive from the classical expression:

IT represents the current global transport in the wiring, corresponding to the addition of every individual load current demand operating simultaneously, and R is the wiring resistance.
A similar structure applies to the commercial sector since they operate at identical domestic sector voltage, with the only difference in the number of rows because commercial installations require higher power. Industrial facilities operate at two alternate current types: low voltage monophasic current for illumination and small appliances and high voltage triphasic current for machinery. In this latter case, there are two options for the PV array configuration: to operate at 220 VAC and convert the voltage to the highest value, currently 380 VAC or 560 VAC, or group panels in series until reaching the selected voltage; the serial includes eight panels for 380 V and twelve for 560 V. If we design the PV array for both, residential or commercial and industrial, the best option is a five serial panel per row for 220 volts and a booster for the industrial facility.
Since the conversion from DC to AC involves power losses, we should reformulate equation 3; therefore, replacing equations 4 and 5 in equation 3 and considering voltage conversion power losses:

I is the load element current demand, and ηDC-AC is the voltage converter efficiency.
Biomass
Biomass is a resource obtained from organic matter, from which we generate energy in various ways. One of the most common and oldest ways to use biomass is burning wood to produce heat, but it is not the only way to take advantage of this resource. Another way to use biomass is composters, devices in which we add organic waste to generate compost as a substitute for fertilizers in crops. Another possibility is the generation of fuels such as biodiesel, bio-gasoline, or biogas, which can function as substitutes for fossil fuels in combustion engines.
Biomass power generation derives from the combustion of organic matter, converting heat into electricity through thermodynamic processes. There are also other methods, such as gasification, which consists of decomposing biomass into a biogas that can replace natural gas directly in a combined cycle plant, or pyrolysis, a process similar to gasification in which, in addition to biogas, we produce liquid biofuels used in another process [13].
Biomass as an energy resource has the advantage of being renewable because of easy replenishment: plant resources such as wood can be replenished by replanting trees; however, excessive consumption of the resource could be faster than its generation, and in the example given of wood, cause deforestation by not being able to replace the trees at the same speed that they fall, and that is why biomass requires consumption responsible. On the other hand, burning biomass releases GHG, but as it comes mainly from plant sources, it has been considered clean energy since plants absorb atmospheric carbon dioxide, leading to a null GHG. However, other authors affirm that the calculation of this balance is incorrect and should be rectified, proposing alternative ways of calculating this carbon footprint in such a way that biomass presents a negative balance for the environment, although the carbon footprint is still much lower than that of fossil fuel [14]. Furthermore, the efficiencies of biomass-to-electric energy conversion sciences are comparable to those of gas plants or steam, so biomass is energetically efficient, presenting a lower environmental impact. Biomass is sustainable, provided there are no supply problems [15,16].
Power delivered by biomass derives from the expression:

Q is the biomass heat power, á¹Â is the biomass consumption rate, and ηbio is the conversion process efficiency.
If biomass power generation is the only source:

Equation 8 provides a practical method to determine the biomass reservoir to maintain power generation for the operating time. Since the biomass reservoir requires refilling periodically, a constant supply must be provided to ensure the process is not interrupted.
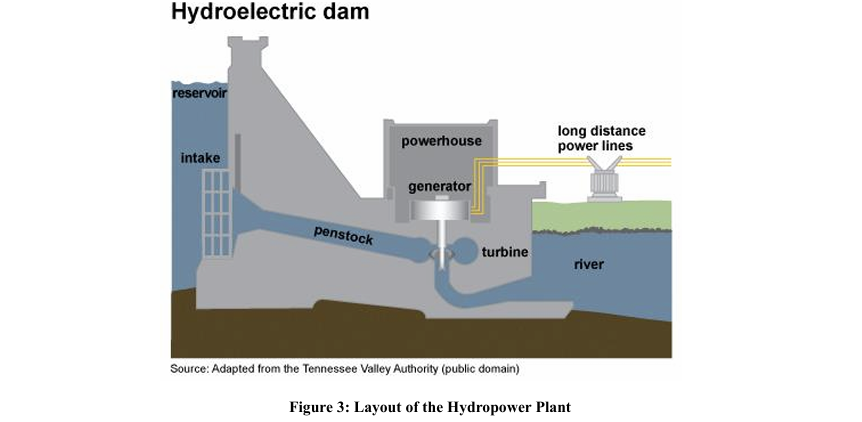
Hydroelectric
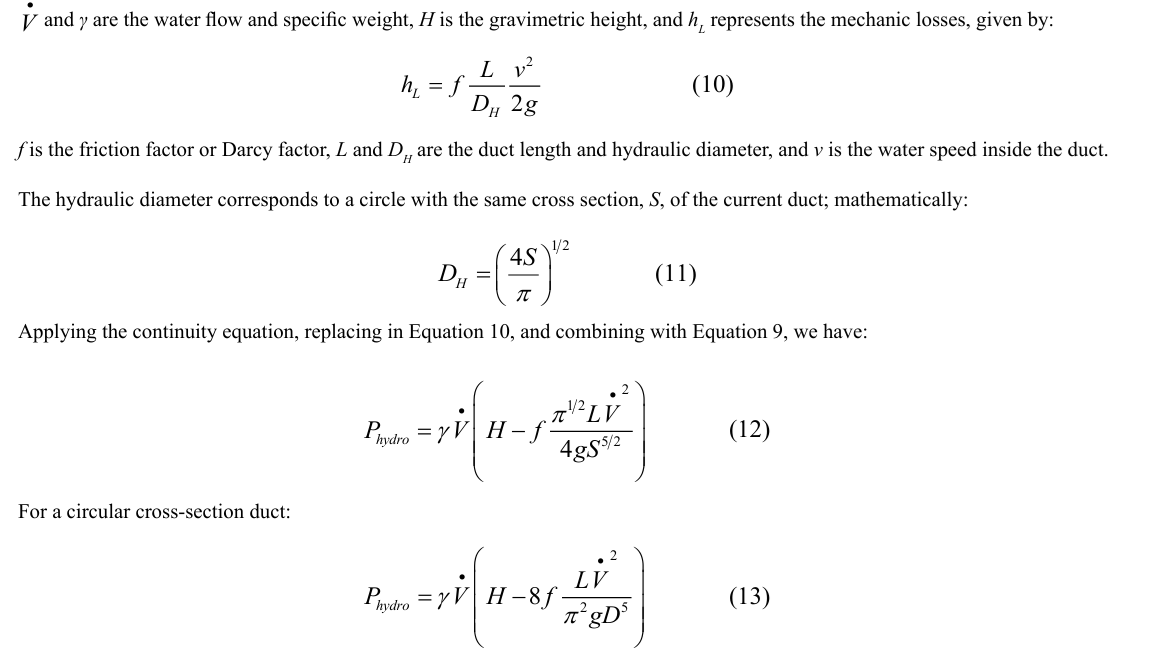
Hydropower generation links the gravitational to kinetic energy conversion in a mechanic turbine, which supplies rotational energy to an electric generator to produce electric current. Using the classical expression for the hydropower generation, the fluid flow, currently water, needed to generate specific power is determined.

Project Design
PV Power Plant
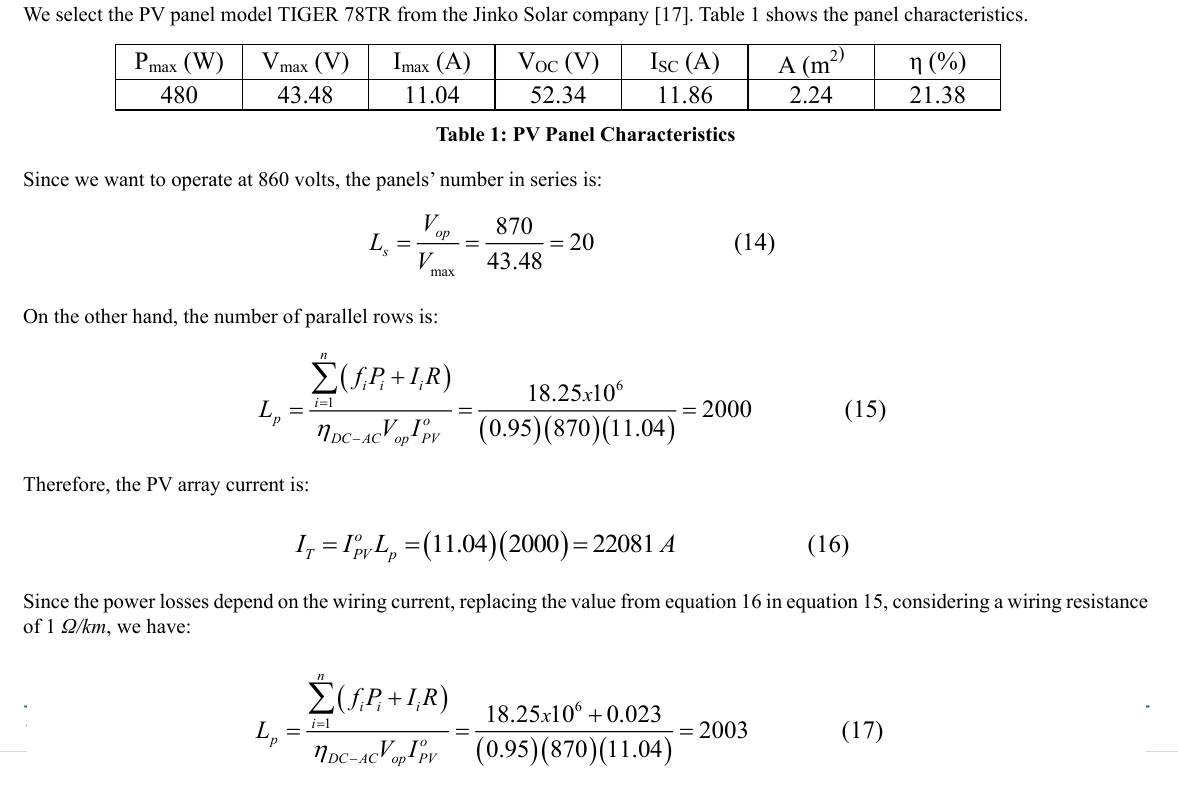
The deviation between row numbers with and without considering power losses is negligible, lower than 0.13%. Figure 1 shows the PV array layout.
Another factor influencing the PV array row number is the temperature since the current generated by a PV panel depends on it. Considering an average coefficient value of 2.17 mA/ºC and a maximum working temperature of 65º C, representing an increase of 40º C related to standard conditions, the PV array current increase is 0.9%, which compensates for the wiring power losses [18-20]. Therefore, we adopt the 2000 parallel row number as the reference for our system.
Because a power converter of 18.25 MW requires a specific design and is excessively expensive, a 1 MW converter unit is used to transform continuous current into an alternate current for the external load. A safety factor of 10% is applied for the power conversion, resulting in 20 converter units of 1 MW connected in parallel. The safety factor covers power losses derived from PV panel partial shading due to powder, cloudiness, or bird excrement.
The global PV array efficiency lowers because of the power losses and temperature; the new value is:

On the other hand, the Performance Ratio (PR), which represents the efficiency associated with wiring and shading power losses are: 
The obtained PR value corresponds to a well-designed PV array. Figure 1 shows the PV array layout.
The PV panel's tilt is 30º, corresponding to the best inclination for optimum performance according to yearly operating conditions. All parallel strings connect to a single power converter. 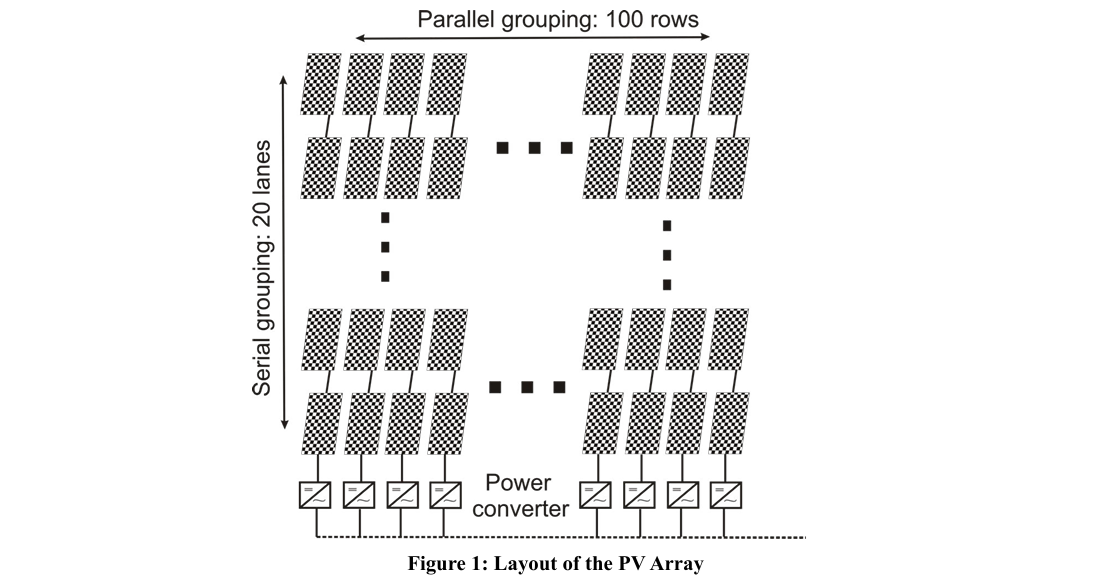
Biomass Power Plant
Biomass plants operate analogously to steam plants fueled by fossil fuels: the biomass burns and heats a fluid work, like water, which evaporates, generating steam that rotates a turbine, producing electricity. In Spain, there are numerous biomass plants; among them is the 50 MW Huelva power plant, with an annual consumption of 500,000 tons of biomass per year [21]. For the simulation, we initially worked with a power plant of a smaller size, 5 MW, operating with oak wood with a heating value of 0.746 GJ/tree when the diameter exceeds 10 cm [22]. Since these trees have a usable biomass of 43.9 kg according to this same source, the calorific value of this type of wood per unit of mass is 16.99 MJ/kg; therefore, to supply the power desired, considering an efficiency of 40% of the process, the consumption must be 2648.12 kg/h.
This energy is produced directly in alternating current, so there is no need for an inverter, only transformers to raise and reduce the voltage, as in the case of the PV field. The efficiencies are the same for the solar PV field: 0.9 for the transformation section between low and medium voltage and 0.95 for the section between medium and high tension. A significant advantage of the biomass power plant is the storage capacity since we can store wood for later use if necessary. The biomass power plant can operate at variable output power depending on energy demand, adapting the power generation by increasing or reducing the wood consumption. We can stop the biomass power plant and easily restart operation on demand.
Figure 2 shows the schematic representation of the biomass power plant.
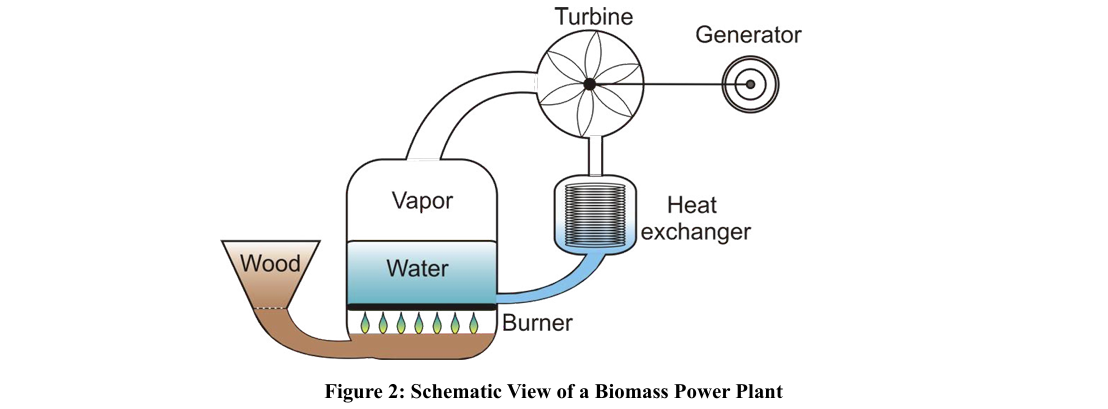
The wood is introduced into the hopper from which the burner is fed through a trap door that allows the required amount to pass through; the combustion process heats the water, converting it into steam that is transported to a turbine, causing the blades to rotate and turning the shaft that is connected to an electric generator, which produces the necessary electric current. The heat flow generated during the burning process raises the water temperature according to: 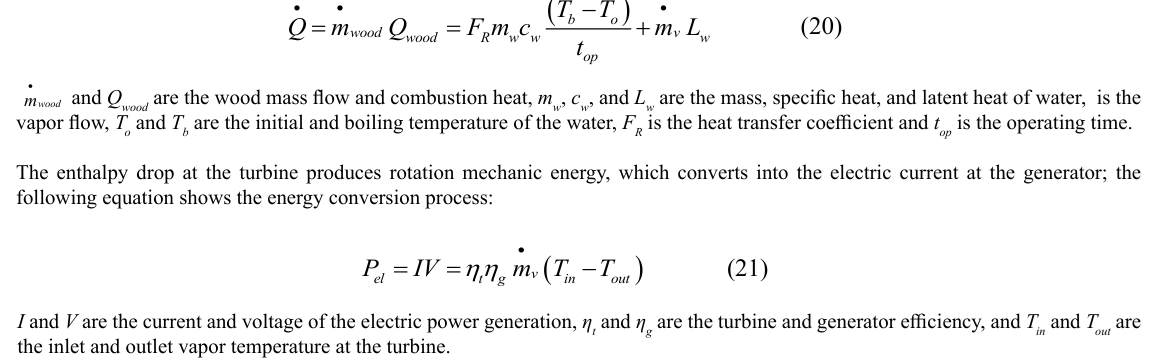
Combining equations 20 and 21 and replacing the wood mass flow:

Hyderpower Plant
A hydropower plant can operate in a one-way or reversible mode; in the first mode, the power plant only generates energy by using a one-way turbine; in the second mode, the turbine reverses when necessary to pump water, storing energy under gravimetric mode. This second option reduces the turbine's global efficiency, but allows working in a two-way mode, energy generation, and storage.
Hydroelectric power plant follows Fluid Mechanic principles to determine power generation according to:
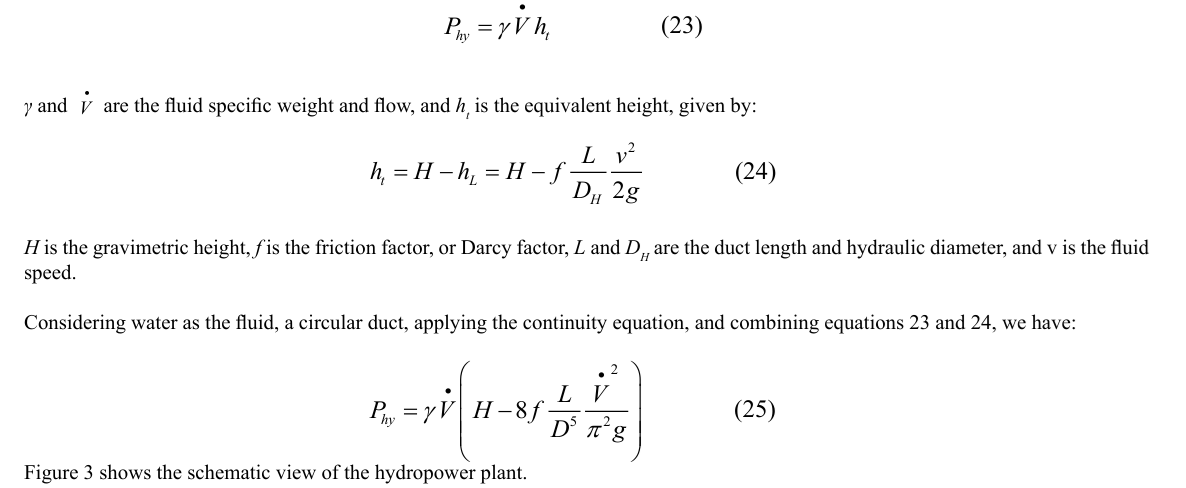
In current operation, the hydroelectric damn uses only a fraction of the water flow supply to the reservoir since the other fraction corresponds to the ecologic flow used for irrigation, animal watering, industrial applications, and human needs. Equation 25 continues applying with the fluid flow, V• , now the water supply and ecologic flow differential. Energy Demand
Considering a prototype installation whose energy demands corresponds to Figure 4:
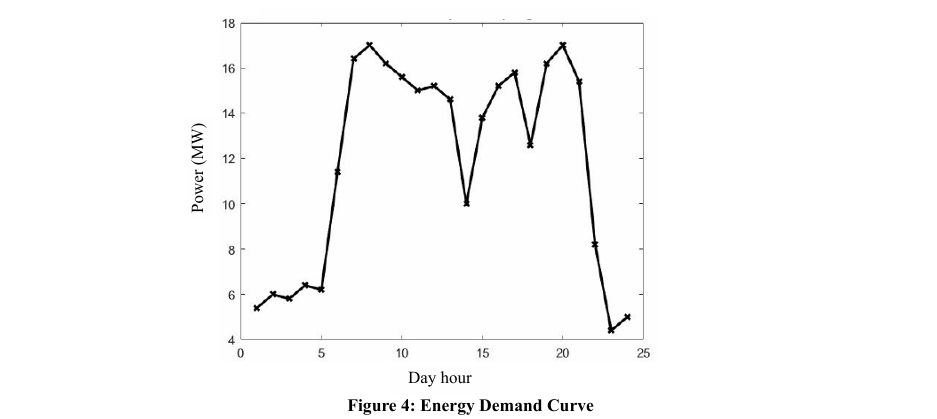
The energy demand curve derives from current data adapted to the maximum supply power from energy sources.
System Configuration
The system configuration is presented in Figure 5.
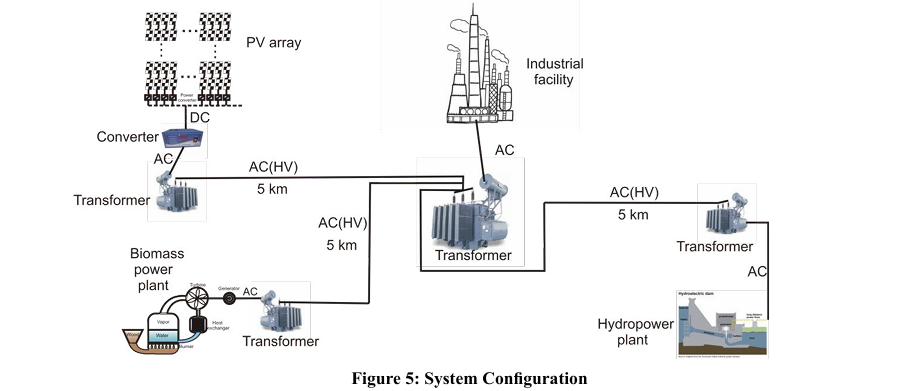
The current generated at the power plants is transported at a high voltage, 32 kV, to reduce energy losses during transportation; therefore, a transformer converts low into high alternate voltage. Since the electric generator at any of the three power plants supplies power at different voltages, the system includes individual transformers for every power plant; the three transportation lines merge into one before entering the principal transformer, which reduces the line's high voltage (32 kV) to the industrial facility operating one, 560 VAC.
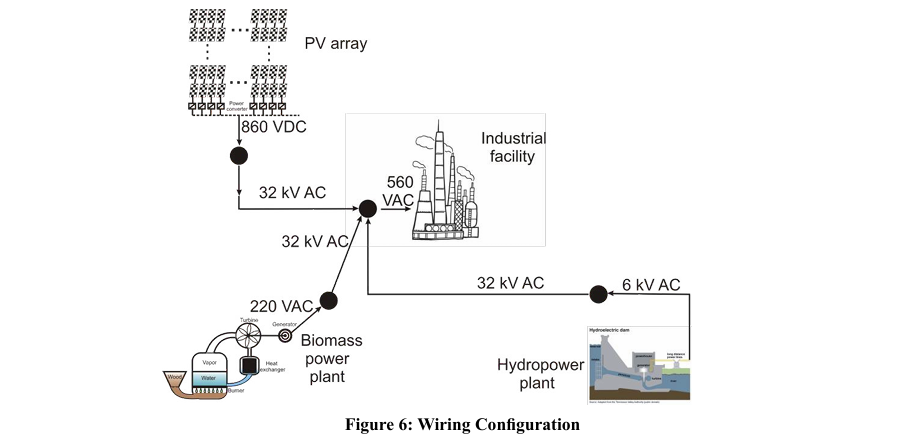
The wiring configuration (Figure 6) significantly reduces energy losses. Considering a unity output power from every power plant, we have: 
Equation 26 shows that the reduction in energy losses is 96.4% per power unit.
Control System
The objective of the control system is to select the most suitable energy source from a multiple renewable hybrid energy system to inject power into the grid when the energy balance between generation and demand is positive, operating at optimal performance.
The protocol for the control system operates under the following specific Criteria:
- The hydropower plant is the last to connect because water is easily stored in the reservoir until necessary for supplying hydroelectric energy; therefore, we can regulate the power supply, keeping the hydro resource
- Hydraulic resources are prioritized over biomass since water is essential for human life and fluvial ecosystems; therefore, water reservoirs are prioritized over biomass storage.
- The protocol algorithm preserves water reserve, if possible.
- The control system evaluates the efficiency in supplying power to load from photovoltaic and biomass power plants, considering the generation process, energy conversion from DC to AC or vice versa, and transportation losses.
- The protocol operates based on the absence of an electric storage system.
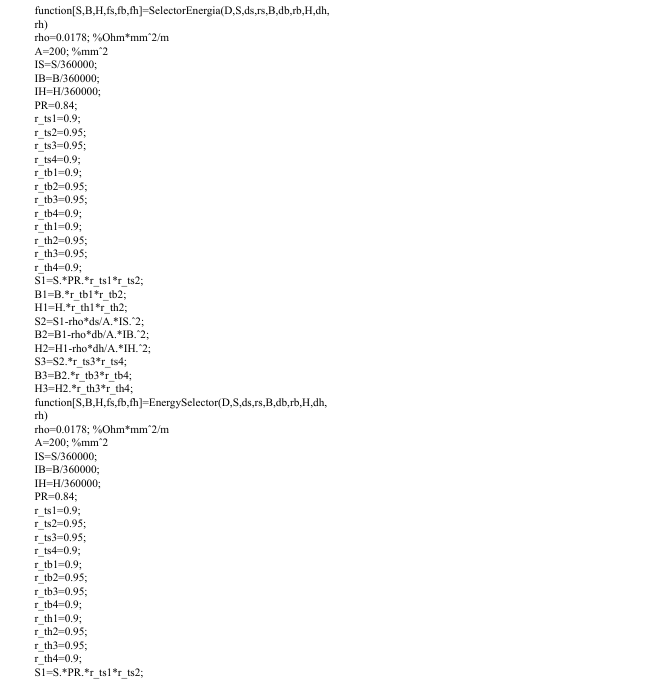
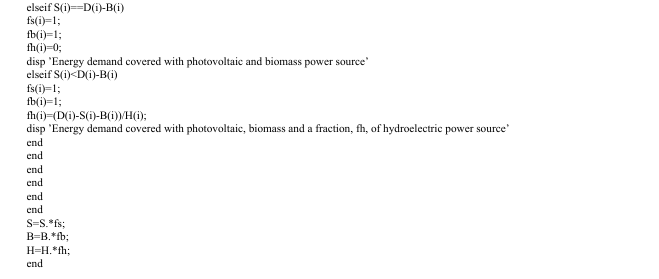
The protocol is developed in MATLAB language. The Annex shows the Matlab program developed for the control system protocol. Figure 7 shows the protocol flowchart.
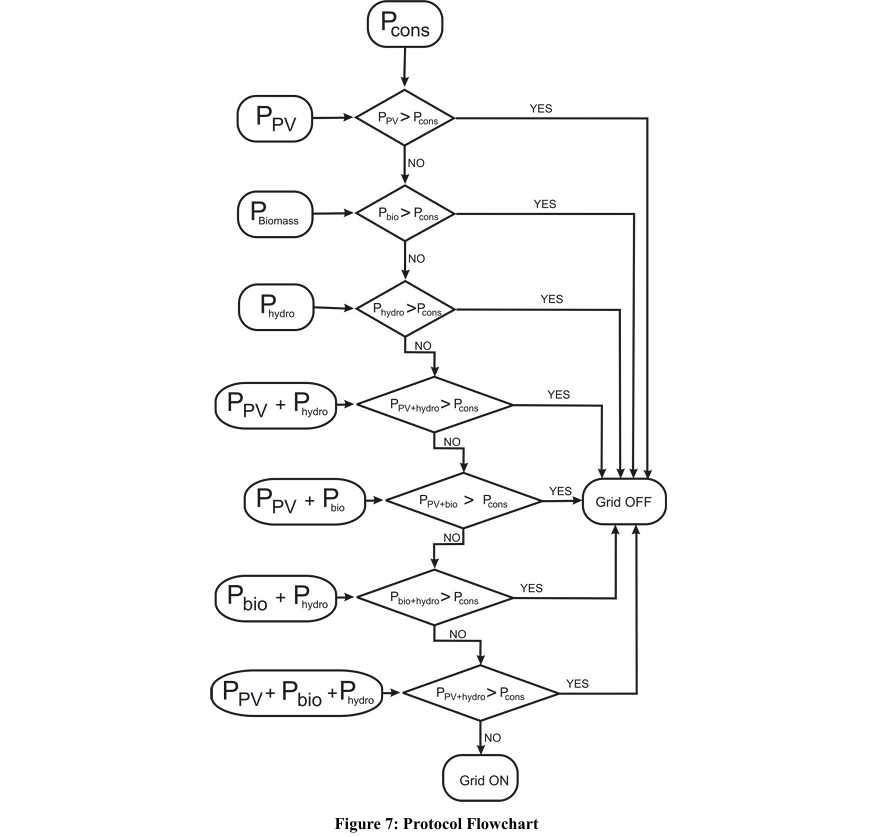
As seen in Figure 7, the protocol sequentially compares the energy demand with power generation at every power plant, photovoltaic, biomass, and hydroelectric. Photovoltaic is always the priority, followed by biomass, leaving hydropower as an energy reservoir. The protocol stops the checking process, connecting the tested power plant with the industrial facility and interrupting the connection to the other plants if any power source exceeds the energy demand. The protocol compares the combined output power of two power sources with the energy demand following the sequence: photovoltaic plus biomass as the first option, photovoltaic and hydro as the second option, and biomass plus hydro as the last option if none of the three power sources supplies enough power to cover the energy demand. As in the first comparative loop, if any of the combinations produce a positive balance, power generation exceeds energy demand, the protocol stops the checking process, connecting the two selected power plants to the load and disconnecting the remaining power source.
If none of the combinations produce a positive balance, the protocol compares the power generation of the three combined power sources with the energy demand; if the balance is positive, the protocol leaves the three power sources connected to the load; otherwise, it opens the grid connection and regulates the energy entering from the grid to obtain a null energy balance.
Simulation
We consider a homogeneous geographical distribution of the power plants located 5 km from the load center. We obtain the power plant efficiency from the literature, using an average value for every energy source type; in our case, the efficiency is 45% for the biomass, 18% for the photovoltaic, and 80% for the hydropower [23-25].
Applying the protocol program shown in the Annex to the energy demand curve in Figure 4, the following results (Figures 8 and 9) are obtained.
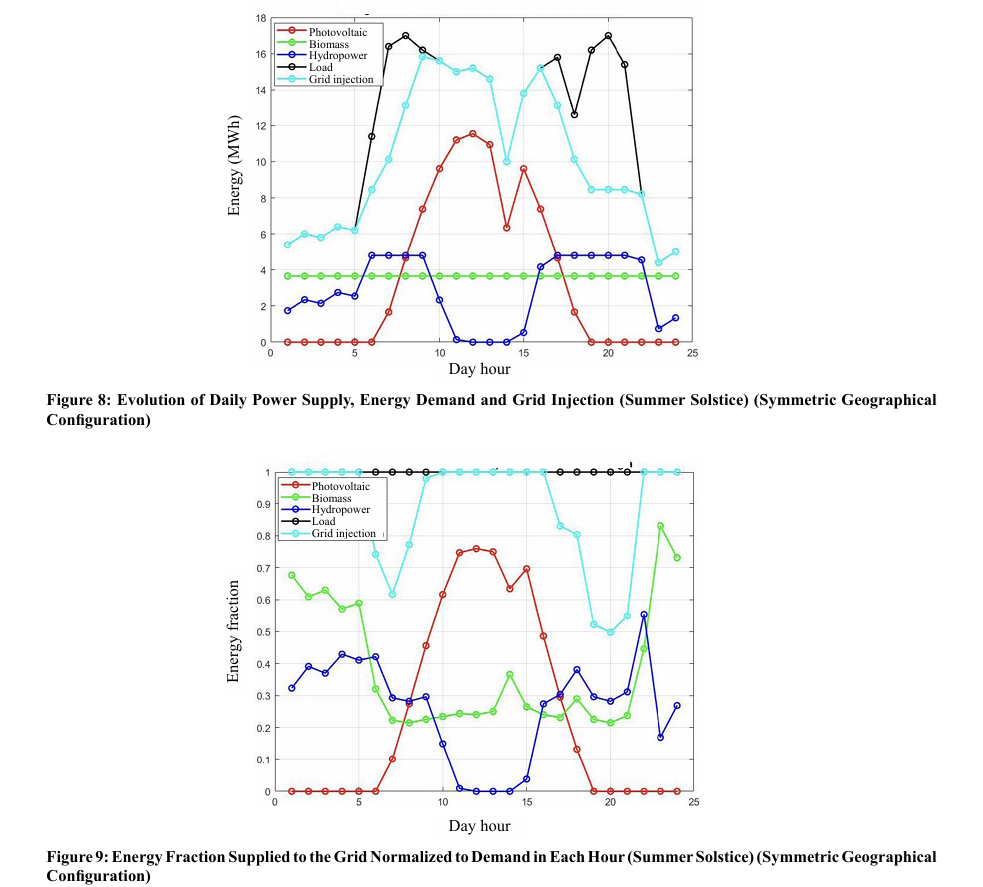
We realize in Figure 8 that the biomass power plant supplies constant energy to the grid. At central day hours, when hydropower disconnects because the photovoltaic power plant operates at maximum performance, the control system regulates this last power type according to energy demand; the reason why we observe a drop in the photovoltaic power injection to the grid, around 14 h, with ups and downs between 10 h and 16 h. This behavior shows that PV power is not the priority but the biomass.
On the other hand, looking at Figure 9, we observe the intervals where the balance between power generation and energy demand is negative, between 6 and 10 h and from 17 to 21 h. These two periods match the lowest solar photovoltaic generation. We should call the reader’s attention to the fact that the simulation runs for the 21st of June, matching the summer solstice when solar production is maximum; if we deal with the winter solstice on the 21st of December, the simulation results are as follows (Figure 10). We observe in Figure 10 a lower photovoltaic power generation and the need to use the hydropower supply most of the time. Extra energy supply is also a characteristic of this year due to a 10% drop in renewable energy generation.

Optimization Process
We can optimize the system performance by making the biomass power plant to supply higher output power when necessary. In such a case, the global output power is 10 MW, operating for 18 hours daily. This configuration, however, represents a 50% increase in biomass consumption, a fact that plant managers should consider to avoid unexpected stops due to a lack of primary matter.
Figures 12 and 13 show the simulation results for the optimized process.
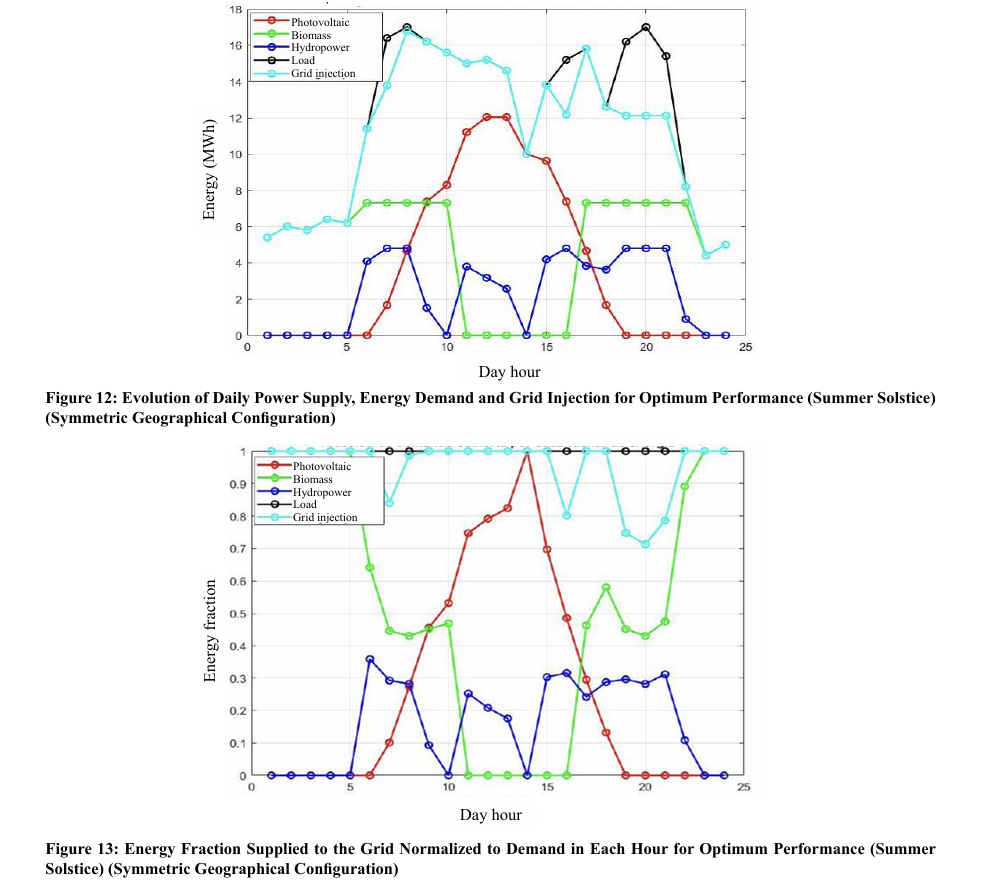
We observe that the optimized system matches the energy demand with higher accuracy since it does not require an external power supply in the morning or at the afternoon peak energy demand between 17 and 21 h. In the non-optimized case, renewable energies cover 50% to 60% of the gap between power generation and energy demand, while in the optimized configuration, the coverage factor is 70%. Besides, the biomass power plant does not operate at maximum output power in the early morning since the energy demand lowers, reducing the power requirements. On the other hand, the biomass power plant may cover the lowest energy requirement daily period, 1.5 MW, which occurs around 16 h, if operating at a higher output power than average due to the decrease in energy demand.
In the late afternoon, it is necessary to supply extra power from the hydroelectric plant or the grid. We should respect the ecological water flow to preserve human, cattle, or agricultural demand when using the hydropower plant at higher output power.
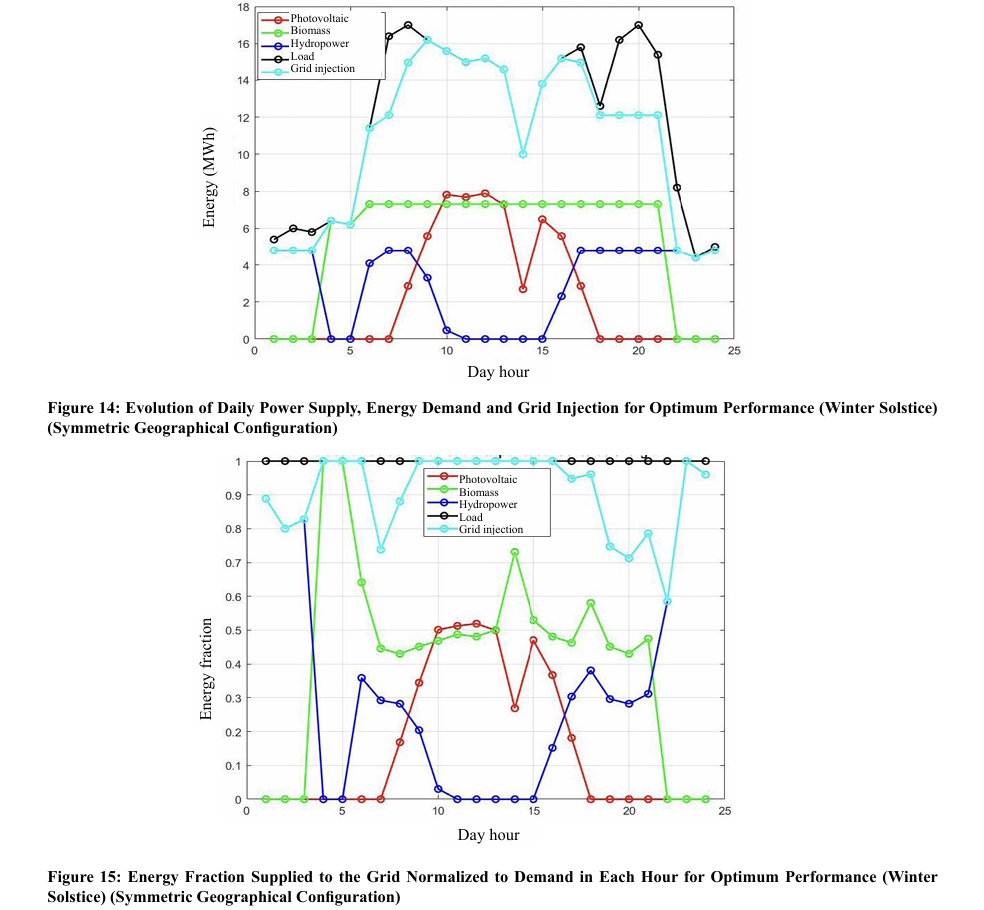
In winter (Figures 14 and 15), the biomass power plant operates during peak energy demand since the photovoltaic resource is lower than in summer. Applying this configuration, we obtain a renewable coverage factor of 60% instead of 50%.
Oversizing the renewable power plants guarantees a 100% coverage factor at the peak energy demand; however, this configuration wastes power during the out-of-peak energy demand time intervals or forces the power plant to reduce energy generation with the subsequent efficiency lowering; therefore, it is interesting to use the grid to cover negative balance or to install a storage unit to compensate for excess and deficit of energy balance.
Geographical Configuration
The proposed geographical distribution may change according to nearby orography and space availability for power plant building. Rearranging the power plant layout, moving the PV array closer to the industrial facility because of its higher adaptability, maintaining the biomass power plant on the original site, and moving away the hydropower plant due to easy access to water flow, we have the following proposed geographical configuration (Table 1):

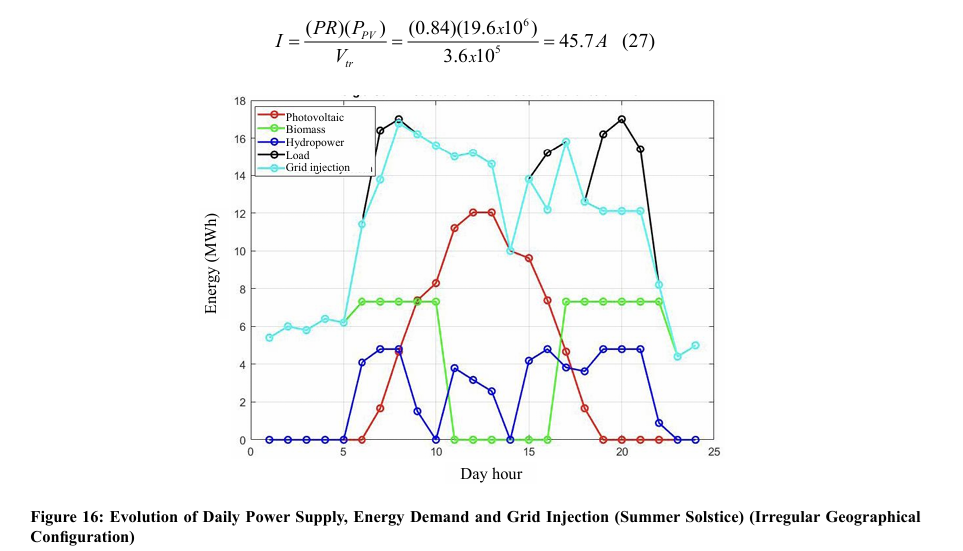
We reduce and enlarge the PV array and hydropower's original distance by ten times. We randomly chose this factor to evaluate the influence of changing distance on power plant performance, individual and collective. Figures 16 and 17 show the simulation results for the new geographical configuration. Hydroelectric power generation remains constant, having an average energy production of 4.80 MWh. The increase in energy losses due to the distance enlargement is negligible compared to power generation, barely 0.02%. A similar situation occurs with the PV array, where the energy loss reduction represents 0.015% of the power generation. Therefore, geographical configuration does not interfere with net power generation, provided the distance is not too long.
Since the distance between the PV array and load center is shorter, we determine the influence of transporting power at lower voltage. For a peak power of 19.6 MW and a transportation voltage of 360 KV, the generated current is:
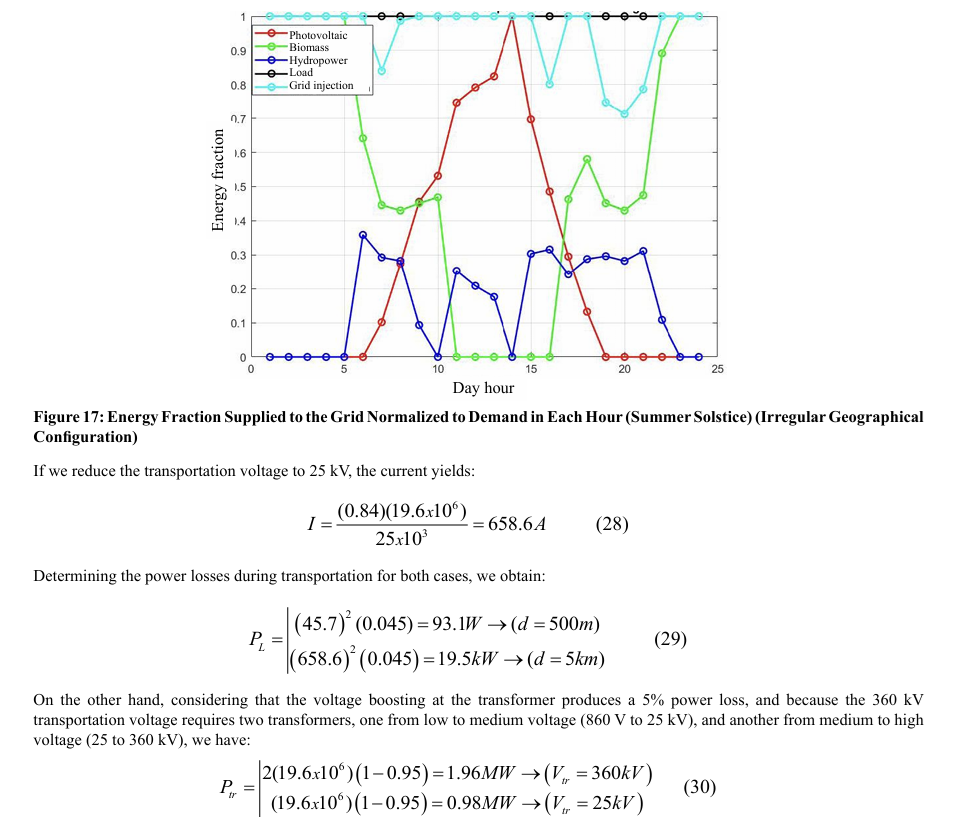
Combining data from equations 29 and 30, it is realized that the short distance configuration for the PV array produces half the power losses than the long distance case, 999.5 kW vs 1960 kW; therefore, it is concluded that reducing the transportation voltage to a medium tension value reduces the transmission power losses. An identical analysis developed for hydropower and biomass power plants leads to a similar conclusion: operating at medium transportation voltage for short distances reduces power losses and improves the system's global performance. Applying the simulation for the medium transportation voltage, results are obtained (Figures 18 and 19). 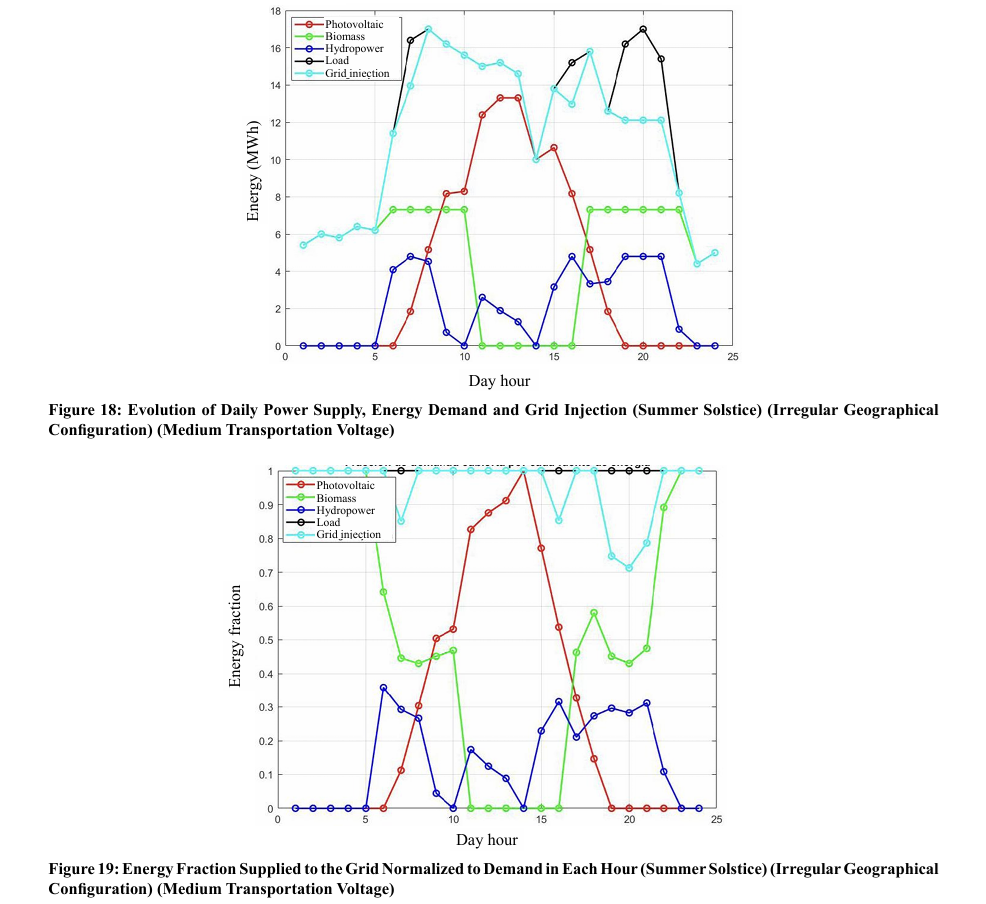
Comparing Figures 17 and 19, we realize that solar photovoltaic power increases in all sunny periods, especially at midday. Indeed, at 16 h, the coverage factor rises from 80% to 85%. A similar situation occurs when comparing data from Figures 16 and 18. Despite the improvement in PV array performance, the biomass power plant continues to have the highest global efficiency, as we see comparing data in the 9 to 10 am interval (Figure 16) when the biomass plant supplies continuous power and the control system regulates the PV array power generation. This situation occurs even when increasing the distance from the biomass power plant to the load center; indeed, the distance at which biomass and PV array efficiency match is:
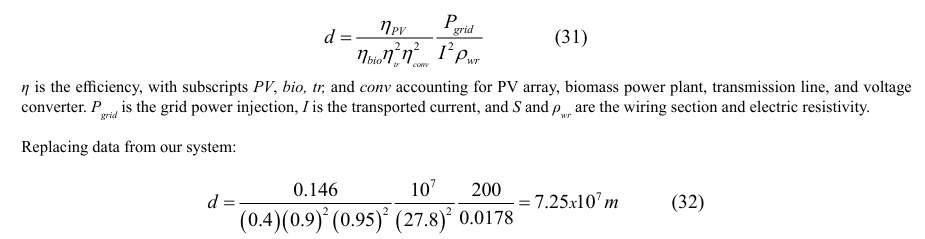
The obtained distance is nonsense; therefore, the control system protocol establishes that biomass global efficiency is higher no matter which is the distance from the load center, and it is considered as the first option for power supply under the setup operating conditions.
Efficiency Influence
The control system protocol prioritizes the power source depending on the efficiency when the energy demand requires a power supply for more than a single source, selecting the most efficient one to cover the maximum energy requirement fraction and leaving the remaining energy demand for the other sources. The Figure 20 diagram shows the protocol flowchart.
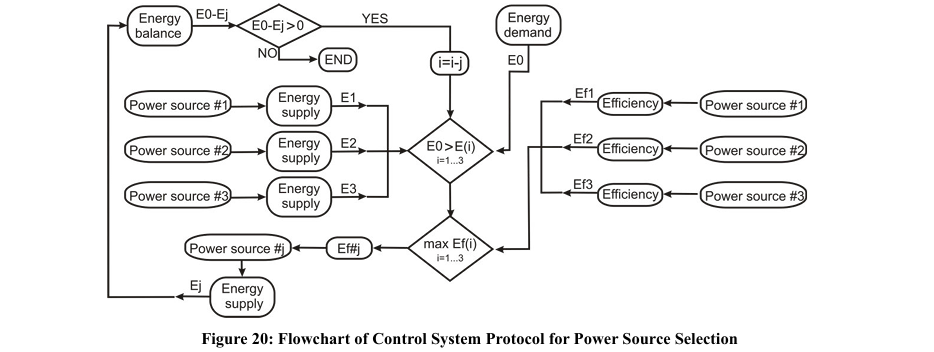
The control system protocol collects information about the energy demand and individual power source generation, comparing energy supply from every source with energy demand; if the balance is positive, the protocol ends, and the routine of the control system verification stops. If the energy balance is negative, the control system evaluates the efficiency of every power source and selects the one with higher efficiency. Next, the control system determines the energy balance between the power supply from the chosen source and energy demand, resulting in a negative value according to previous control statements. Once the energy balance is established, the control system selects the second higher power source efficiency and recalculates the energy balance; if positive, the control system regulates the power supply to the value that makes the energy balance null; otherwise, the loop continues selecting the third power source and evaluating the energy balance, which should be now positive. If the balance is negative, the control system derives the power supply to the grid connection to equalize global power supply and energy demand. We run a simulation test for reduced biomass efficiency, 10% lower, to verify the validity of the control system protocol in improving the system performance; Figures 21 and 22 show the simulation results.
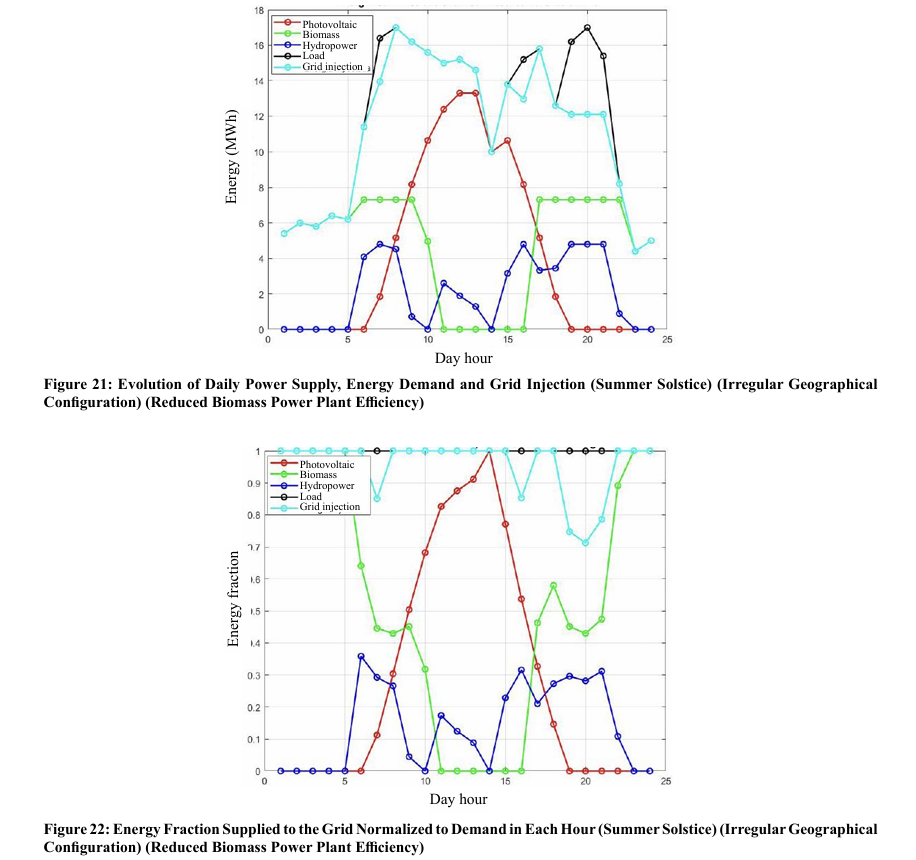
As can be seen, in the morning hours when biomass generation was previously constant, it now falls, while the injected solar energy increases and decreases with the hours of the day, except at 2 p.m., when demand drops and the generated solar photovoltaic energy is higher than energy demand, proving that the program reorganizes the energy that enters and leaves the grid based on its generation efficiency. It was verified that if the solar and biomass power plants had the same generation efficiency, were at the same distance with identical efficiencies, the solar park inverter would make the system prioritize biomass.
Conclusion
An energy management system has been designed for a hybrid set of renewable sources that allows the use of generated energy to be optimized for a given consumption.
Although the hybrid generation system model studied has focused on three specific energy sources, the management system applies to any type of energy source, renewable or not, and any demand curve. The management system prioritizes generation efficiency when selecting the first energy source as a priority, including losses due to transport, generation, and voltage variation in said efficiency. Whenever working with low or moderate currents, the distance from the power plant to the consumption center is a factor with little influence, but it can be more critical if working at higher powers.
Optimization in energy management at work has not been based solely on controlling power plants but adapting generation to demand throughout the day hour to minimize excess or lack of energy and tend towards a zero balance. This measure must be extended and adapted to any time of the year. It is advisable to use energy sources on which the generated power can be controlled, such as hydroelectric and biomass, to obtain a null energy balance over time since this allows optimizing the overall generation efficiency by using a resource whose energy conversion performance does not depend on external factors, as is the case with solar photovoltaic or wind power. Although the system optimizes energy management, it may happen that, depending on the distribution of generation and demand, the energy balance is negative, requiring additional sources.
References
1. Allen, M.R. et al (2018). Framing and Context. In: Global Warming of 1.5°C. An IPCC Special Report on the impacts of global warming of 1.5°C above pre-industrial levels and related global greenhouse gas emission pathways, in the context of strengthening the global response to the threat of climate change, sustainable development, and efforts to eradicate poverty. Cambridge University Press, Cambridge, UK and New York, NY, USA, pp. 49-92.
2. Shafiee, S., & Topal, E. (2009). When will fossil fuel reserves be diminished?. Energy policy, 37(1), 181-189.
3. Roser, M. (2020). Two centuries of rapid global population growth will come to an end. Our world in data.
4. Hannah Ritchie, Pablo Rosado and Max Roser (2020) - “Energy Production and Consumption” Published online at Our World In Data.org.
5. When Will Fossil Fuels Run Out? METGroup Countries. Posted January 18, 2021
6. Roser, M. (2020). Two centuries of rapid global population growth will come to an end. Our world in data.
7. [7] John Twidel & Tony Weir. Renewable Energy Resources. 2nd Edition. Taylor & Francis. London, 2006
8. Rahman, A., Farrok, O., & Haque, M. M. (2022). Environmental impact of renewable energy source based electrical power plants: Solar, wind, hydroelectric, biomass, geothermal, tidal, ocean, and osmotic. Renewable and Sustainable Energy Reviews, 161, 112279.
9. Van Zalk, J., & Behrens, P. (2018). The spatial extent of renewable and non-renewable power generation: A review and meta-analysis of power densities and their application in the US. Energy Policy, 123, 83-91.
10. Jowett, I. G., & Duncan, M. J. (1990). Flow variability in New Zealand rivers and its relationship to inâ?stream habitat and biota. New Zealand journal of marine and freshwater research, 24(3), 305-317.
11. Behabtu, H. A., Messagie, M., Coosemans, T., Berecibar, M., Anlay Fante, K., Kebede, A. A., & Mierlo, J. V. (2020). A review of energy storage technologies’ application potentials in renewable energy sources grid integration. sustainability, 12(24), 10511.
12. Nousol. Solar Energy Systems. PANEL SOLAR LONGI HI MO X6 LR5-72HTH 580M.
13. Abbasi, T., & Abbasi, S. A. (2010). Biomass energy and the environmental impacts associated with its production and utilization. Renewable and sustainable energy reviews, 14(3), 919-937.
14. Johnson, E. (2009). Goodbye to carbon neutral: Getting biomass footprints right. Environmental impact assessment review, 29(3), 165-168.
15. Gustavsson, L. (1997). Energy efficiency and competitiveness of biomass-based energy systems. Energy, 22(10), 959-967.
16. Shafie, S. M., Mahlia, T. M. I., Masjuki, H. H., & Ahmad Yazid, A. (2012). A review on electricity generation based on biomass residue in Malaysia. Renewable and Sustainable Energy Reviews, 16(8), 5879-5889.
17. Jinko Solar. Catálogo de productos 2022.
18. Variación de parámetros fotovoltaicos con la temperatura (2024).
19. Marsh, J. (2019). How hot do solar panels get? PV temperature explained: Energysage. Solar News.
20. Luque, A., & Hegedus, S. (Eds.). (2011). Handbook of photovoltaic science and engineering. John Wiley & Sons.
21. Energía y Celulosa (2023) Huelva — Ence
22. Fernández-Puratich, H., & Oliver-Villanueva, J. V. (2014). Cuantificación de biomasa y valor energético de renovales de Quercus ilex en condiciones mediterráneas. Bosque (Valdivia), 35(1), 65-74.
23. Biomass for Power Generation and CHP. International Energy Agency (IEA).
24. Photovoltaic Energy Factsheet. Center for Sustainable Systems. University of Michigan.
25. Reversible Hydroelectric Power Plants. SOCOTEC.
ANNEX
The input parameters are the energy demand (D), the power generation, photovoltaic (S), biomass (B), and hydro (H), the distance from power plant to load center, ds for photovoltaic, db for biomass, and dh for hydropower, and the power plant efficiency, rs for photovoltaic, rb for biomass, and rh for hydropower.