Research Article - (2021) Volume 2, Issue 1
Classification of Heart Rate Time Series Using Machine Learning Algorithms
Received Date: Sep 20, 2021 / Accepted Date: Sep 28, 2021 / Published Date: Oct 26, 2021
Copyright: Zahra Akbari. This is an open-access article distributed under the terms of the Creative Commons Attribution License, which permits unrestricted use, distribution, and reproduction in any medium, provided the original author and source are credited.
Citation: Zahra Akbari (2021) Classification of Heart Rate Time Series Using Machine Learning Algorithms. Adv Mach Lear Art Inte, 2(1): 55-59.
Abstract
An important diagnostic method for diagnosing abnormalities in the human heart is the electrocardiogram (ECG). A large number of heart patients increase the assignment of physicians. To reduce their assignment, an automatic computer detection system is needed. In this study, a computer system for classifying ECG signals is presented. The MIT-BIH, ECG arrhythmia database is used for analysis. After the ECG signal is noisy in the preprocessing stage, the data feature is extracted. In the feature extraction step, the decision tree is used and the support vector machine (SVM) is constructed to classify the ECG signal into two categories. It is normal or abnormal. The results show that the system classifies the given ECG signal with 90% sensitivity
Keywords
Classification, machine learning, time series, decision tree algorithm, SVM algorithm
Introduction
Time series modeling is a dynamic research area that has attracted the attention of the research community over the past decades. The main purpose of time series modeling is to accurately collect past observations of a time series to create a suitable model that describes the inherent structure of the series. This model is then used for time-series predictions, therefore, time-series predictions can be known as future predictions with an understanding of the past [1].
In medicine, the characteristics of a patient’s clinical condition can be monitored with equipment that receives information about physical, chemical, and biological variables. An example is the ECG , which involves monitoring changes in the electrical potential produced by heart activity over time and is essential for diagnosing many heart diseases and other disorders [2].
Heart Rate Variability
Heart rate variability (HRV ), the difference over time of the oldfashioned between successive heartbeats, is mainly dependent on the extrinsic rule of the heart rate (HR). HRV is supposed to reproduce the heart’s ability to adjust to changing conditions by distinguishing and quickly replying to random incentives. HRV examination is the capability to evaluate general cardiac health and the national of the autonomic nervous system (ANS ) accountable for adaptable cardiac motion. HRV is a suitable signal for sympathetic the position of the ANS. HRV mentions differences in the beat intermissions or congruently in the prompt HR. The usual erraticism in HR is because of the autonomic neural rule of the heart and the cardiovascular system [3].
Different randomization and neural network methods for modeling and predicting time series, despite their strengths and weaknesses, are very successful in forecasting programs [4, 5]. Recently, a new statistical learning theory, the Support Vector Machine (SVM), has gained more attention for classification and prediction. SVM was originally designed to solve pattern classification problems, such as optical character recognition, face recognition, and text classification, etc., but soon extensive applications were designed in other areas, including function approximation, regression estimation, and time-series predictions, Nima hatami, (2017) [6].
Time Series Classification
Time series classification (TSC) is a growing area of machine learning research [7, 8]. There are two options when it comes to categorizing a time series. One of these is to use a special method. An example could be LSTM or a recurring neural network. Another is to extract the features of the series and apply them to normal supervised learning [9].
Support Vector Machines
Support vector machines (SVM) is a core created machine learning family of approaches that are used to precisely categorize both linearly divisible and linearly attached data. The basic knowledge when the information is not linearly divisible is to convert them to a developed dimensional space by using a conversion kernel purpose. In this new space, the samples can typically be categorized with higher precision. Many kinds of kernel purposes have been advanced, with the greatest used ones being polynomial and circular-based.
Decision Tree
A decision tree is a flowchart-like tree building, where each interior node signifies a test on an aspect, apiece branch signifies an ending of the examination, class label is characterized by each leaf node. Assumed a tuple X, the characteristic values of the tuple are verified contrary to the decision tree. A route is drawing from the root to a leaf node which grips the class forecast for the tuple. It is easy to change decision trees into classification rubrics. Decision tree learning uses a decision tree as a prognostic model which maps explanations about an entry to deductions about the item’s mark value. It is one of the prognostics demonstrating methods used in numbers, data mining and machine learning. Tree copies where the board flexible can take a limited set of values are called classification trees, in this tree construction, leaves signify class labels and branches characterize combinations of topographies that lead to those class labels. Decision tree can be built comparatively fast associated to other approaches of cataloguing. SQL announcements can be built from tree that can be used to access databases professionally. Decision tree classifiers gain alike or better precision when associated with other classification approaches. An amount of data mining methods has previously been done on instructive data mining to advance the presentation of pupils like Regression, Genetic algorithm, Bays classification, k-means gathering, subordinate guidelines, forecast etc. Data mining methods can be used in instructive arena to improve our sympathetic of learning procedure to emphasis on classifying, mining and assessing variables connected to the learning procedure of pupils. Classification is one of the greatest commonly [10].
Materials and Methods
Time characteristics are important for data processing data as the data under review provides this feature. This process can be used to support the decision-making process to extract relevant and interesting knowledge from a large data set, including knowledge [10]. Learning Machine (ML) helps support data mining. However, most ML methods do not deal directly with the time feature because they assume that the data are distributed independently and uniformly. However, since the data set is time-oriented, the occurrence of observation at a particular point in time usually depends on the values already observed [7, 11].
The proposed approach jointly applies two strategies to construct a feature display for time series attributes. On the one hand, some of the extracted features are typically related to descriptive statistics such as mean, standard deviation, and maximum and minimum, which provide information about the global behavior of a time series. After that, this representation will be the attribute value as input for ML algorithms [12].
Step 1: Time Series Preprocessing
In the first phase, the time series for processing some common problems in time data, such as differences in scale and time interval, data with noise; And the presence of missing values are preprocessed.
Step 2: Extraction Properties
In this step, the properties are identified using global feature extraction features and local descriptions from time-series data. Two independent stages make up this stage [13].
In this research first, the ECG signal data is prepared from the database and their preprocessing will be done to select the appropriate signals. Then the appropriate properties are extracted and based on these properties, the classification operation is performed.
Build a categorized model based on the labeled time series and then use that model to predict unlabeled time-series labels. To classify time series in python, you must first extract the properties from the time series data, which is done with the decision tree algorithm, and then use existing classification techniques such as SVM on that set of features.
Time series to anticipate some common problems in time data, such as differences in scale and time interval, data with noise; and the existence of missing values. Is used. Properties are then identified by extracting global properties and local descriptions from time-series data. Next, machine tree decision and learning algorithms are used to construct a prediction model. The choice of an algorithm should be according to the ultimate goal of the extraction patterns. The selected algorithms are then applied and the generated models can be evaluated using objective as well as qualitative methods.
In this research, the MIT-BIH natural cytosine rhythm database, MIT-BIH arrhythmia database, MIT-BIH atrial fibrillation database, and MIT-BIH malignant ventricular arrhythmia database were used. The MIT-BIH Arrhythmia Database contains 48 pieces of two-way ambulance ECG recordings, each recording lasting about 30 minutes at a sampling frequency of 360 Hz, the MIT-BIH Normal Rhythm Database includes 18 long-term ECG recordings, MIT-BIH Database consists of 25 long ECG cycles with a sampling frequency 250 HZ and the MIT-BIH malignant ventricular arrhythmia database containing 25 minutes recording at 250 Hz. A total of 53 ECG files includes 18 normal rhythms. Figure 1 shows the diagram of the proposed classification algorithm:
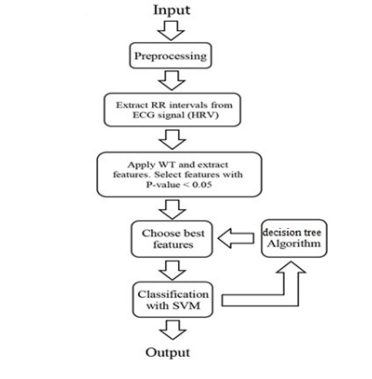
Figure 1: Diagram of the proposed classification algorithm
Datasets and Evaluation Specifics
In this study, two different datasets will be examined, including records obtained from healthy young and elderly people. The second data set includes people who are naturally at risk for cardiovascular disease.
An electrocardiogram was recorded from 25 men aged 32 to 89 years and 22 women aged 23 to 89 years, about 60% of whom were hospitalized. The signals are recorded from two channels, and due to the differences in the anatomical features of the individuals, lead II and V1 are used in most of the recordings. The portfolio frequency is 360 Hz. The database includes 48 half-hour electrocardiograms recorded in 24 hours out of 47 people.
Pulses are monitored and marked using a QRS tilt detector. Each signal is then interpreted by two cardiologists. Approximately 110,000 beats of this path have been examined and their type has been identified.
We first receive the data from the following: Address https://www.physionet.org/physiobank/database/mitdb/
Results and Discussion
The third dataset is attained by mining HRV features from MITBIH databases, which contain: MIT-BIH Normal Sinus Rhythm, Normal Sinus Rhythm RR Interval, MIT-BIH Arrhythmia, MITBIH Supraventricular Arrhythmia, BIDMC Congestive Heart Failure, and Congestive Heart Failure RR-interval. The normal and abnormal sample signals in the MIT-BIH database are shown in the following figures, respectively. Before extracting the signal properties, all ECG signals are destroyed using a simple medium filter. The output of the feature extraction using the decision tree can be seen in the figure below.
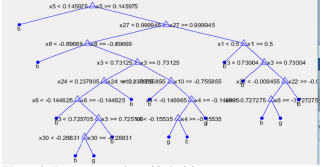
Figure 3: Feature extraction with decision tree
The version of normal signals is shown in Figure 4a and the abnormal signals are shown in Figure 4b. The noisy version of normal signals is shown in Figure 4c.

Figure 4a: Normal signals
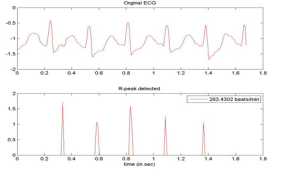
Figure 4b: Abnormal signals
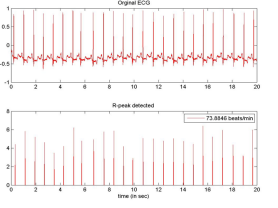
Figure 4c: Normal signal De-noised
Evaluation Specifics
For assessment of the classifiers on each dataset, we use 10x10- fold cross-validation. Assessment measures used are normal in BTS examines: sensitivity (SENS), and specificity (SPEC):

Where TP, TN, FP, and FN are the records of: true positives, true negatives, false positives, and false negatives, correspondingly. For multiclass event, these measures can be gained from the misperception matrix by associating amounts of examples for each class in the matrix beside cases of all the other classes. The described values have been weighted and averaged amongst classes.
Factors of the algorithms were altered in order to gain the best possible consequence using methodical method on the first 10-fold iteration.
In summary, for evaluation purposes, we use standard criteria in the field of medicine, namely General Classification Accuracy (ACC), Sensitivity (SENS), Specificity (SPEC), and Positive Predictive Value (PPV).

Finally, the classification of a signal is analyzed using the SVM classifier with the help of statistical features extracted from the recorded version of the input ECG. From k-fold, cross-validation is used. Figure 5 ECG signal classification shows the analysis of the ROC curve and the tangled matrix. It can be seen from Figure 5 that the ECG system also offers 90% in terms of sensitivity, specificity, and accuracy.
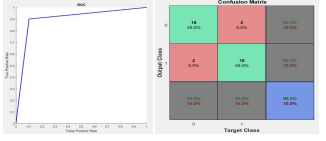
Figure 5: ROC Curve, Confusion Matrix
In this research, ECG signal classification has been analyzed using feature extraction. MIT-BIH arrhythmia database records are used for classification work. First, the processing is performed using a medium filter and then statistical properties are extracted. Finally, DT-SVM-based classification was used to classify the signals. Experimental results show the performance of the ECG signal classification system with promising results. The DT-SVM classifier accurately classifies 90% of the given ECG signal with simple statistical properties.
Comparison of DT-SVM with models used in other studies Neural Networks
These are models of information processing, as the name implies, in this way the information of the human nervous system is processed. An important aspect of this information model is its unique structure. Many highly interconnected processing paradigms (commonly referred to as neurons) work together to solve very specific problems.
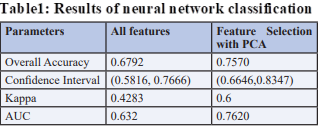
The neural network model has been trained several times to change the number of hidden layers as well as the decay factor, and the light adjustment for maximum accuracy is best achieved with 1 hidden layer and 13 neurons. The results of neural network classification are shown in Table 1 [14]
On average, prediction (in case of regression) of individual trees works. This is a simulation of prediction trees (decision trees) in which the result of each tree depends on the value of a randomly sampled vector independently with the same distribution for all forest trees. Random forests try to reduce the high variance problems often seen in single-decision trees by reducing the average balance between the two boundaries.
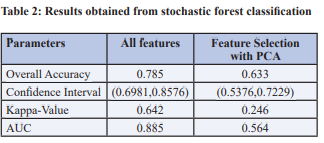
In The case of classification problems, according to a set of random predictor variables and simple trees, the Random Forest algorithm determines a margin function, which determines the degree of an average number of votes for the actual class that is higher than the average number of votes for each other class many classification trees grow in the dependent variable of random forests. If we want to classify a new object, we place the input vector under each tree and then classify each tree. So, each tree belongs to a specific class. The class with the highest number of votes is selected as the result of a random forest. Table 2 shows the results obtained from the stochastic forest classification, Anish batra [15-17].
Conclusion
A MATLAB program is provided for ECG processing and classification [18]. This project has succeeded in creating a program that provides feature extraction and classification as normal and abnormal examples. We have used split samples obtained from the MIT-BIH site and in this dissertation, we have used the MATLAB programming language in the feature identification step to classify the time series of ECG signals by selecting the decision tree feature [19, 20].
Future works
For future work, the weight of each selected feature will be determined in the ECG signal classifier and will be expanded on future findings in future work by evaluating information amplification techniques performed by time series analysis of different heart rate types. Comparisons will also be made with other machine learning methods, which include assessment of random forests, cannulation neural networks, and other methods.
References
1. T Raicharoen, C Lursinsap, P Sanguanbhoki (2003) “Application of critical support vector machine to time series prediction”, Circuits and Systems, 2003. ISCAS ’03. Proceedings of the 2003 International Symposium 2003: 741- 744.
2. Saul JP (1990) Beat-to-beat variations of heart rate reflect modulation of cardiac autonomic outflow. News Physiol Sci 5: 32-37.
3. Myrela Alves, David M Garner, Anne M G G Fontes, Luiz Vinicius de Alcantara Sousa, Vitor E. Valenti (2018) Linear and Complex Measures of Heart Rate Variability during Exposure to Traffic Noise in Healthy Women WILEY 2018: 14.
4. Fazle Karim, Somshubra Majumdar, Houshang Darabi, Shun Chen (2018) Lstm fully convolutional networks for time series classification. IEEE Access 6: 1662-1669.
5. Kaya H, Gunduz-oguducu S (2015) A distance-based time series classification framework. Information Systems 51: 27- 42.
6. Nima Hatami (2017) Bag of Recurrence Patterns Representation for Time-Series Classification, 2017.
7. Imtiaz Awan, Wajid Aziz, Imran Hussain Shah (2018) Studying the dynamics of interbeat interval time series of healthy and congestive heart failure subjects using a scale based symbolic entropy analysis PLOS ONE 2018: 1-18.
8. G.P. Zhang, “A neural network ensemble method with jittered training data for time series forecasting”, Information Sciences 177: 5329-5346.
9. Faizal Mahananto (2017) Simple Symbolic Dynamic of Heart Rate Variability Identify Patient with Congestive Heart Failure, 2017. ELSEVIER 10. Himani Sharma, Sunil Kumar (2013) A Survey onDecision Tree Algorithms of Classification inData Mining, International Journal of Science and Research (IJSR), 2013.
11. Wajid Aziz (2014) classification of heart rate signals of healthy and pathological subjects using threshold-based symbolic entropy, 2014.
12. J Pan, W J Tompkins (1985) Real-time QRS detector algorithm, IEEE Trans. Biomed. Eng 32: 230-236.
13. M Adnane, Z Jiang, S Choi (2000) Development of QRS detection algorithm designed for the wearable cardiorespiratory system, Comp. Meth. Prog. Biomed 93: 20-31.
14. R. Kitney, D Linkens, A Selman, A McDonald (1982) The interaction between heart rate and respiration: part II – nonlinear analysis based on computer modeling, Automatica 4: 141-153.
15. Anish Batra (2016) Classification of Arrhythmia Using Conjunction of Machine Learning Algorithms and ECG Diagnostic Criteria, International Journal of Biology and Biomedicine, 2016.
16. S Kiranyaz, T Ince, M Gabbouj (2015) “Real-time patientspecific ECG classification by 1-D convolutional neural networks”, IEEE Transactions on Biomedical Engineering 63: 664-675.
17. S Basu, YU Khan (2015) “On the aspect of feature extraction and classification of the ECG signal”, IEEE Communication, Control, and Intelligent Systems 2015: 190-193.
18. SH Jambukia, VK Dabhi, HB Prajapati (2015) “Classification of ECG signals using machine learning techniques: A survey”, IEEE International Conference on Advances in Computer Engineering and Applications 2015: 714-721.
19. A Rizal, S Hadiyoso (2015) “ECG signal classification using Hjorth Descriptor”, IEEE International Conference on Automation, Cognitive Science, Optics, Micro-ElectroMechanical System, and Information Technology 2015: 87- 90.
20. Andre G Maletzke, Huei D Lee, Gustavo E.A.P.A. Batista (2013) Time Series Classification using Motifs and Characteristics Extraction: A Case Study on ECG Databases. Fourth International Workshop Proceedings, Eureka-2013.


